How can I plot the model averaged fit and the individual fits?
library(ssdtools)

dist <- ssd_fit_dists(ssddata::ccme_boron)
ssd_plot_cdf(dist, average = NA)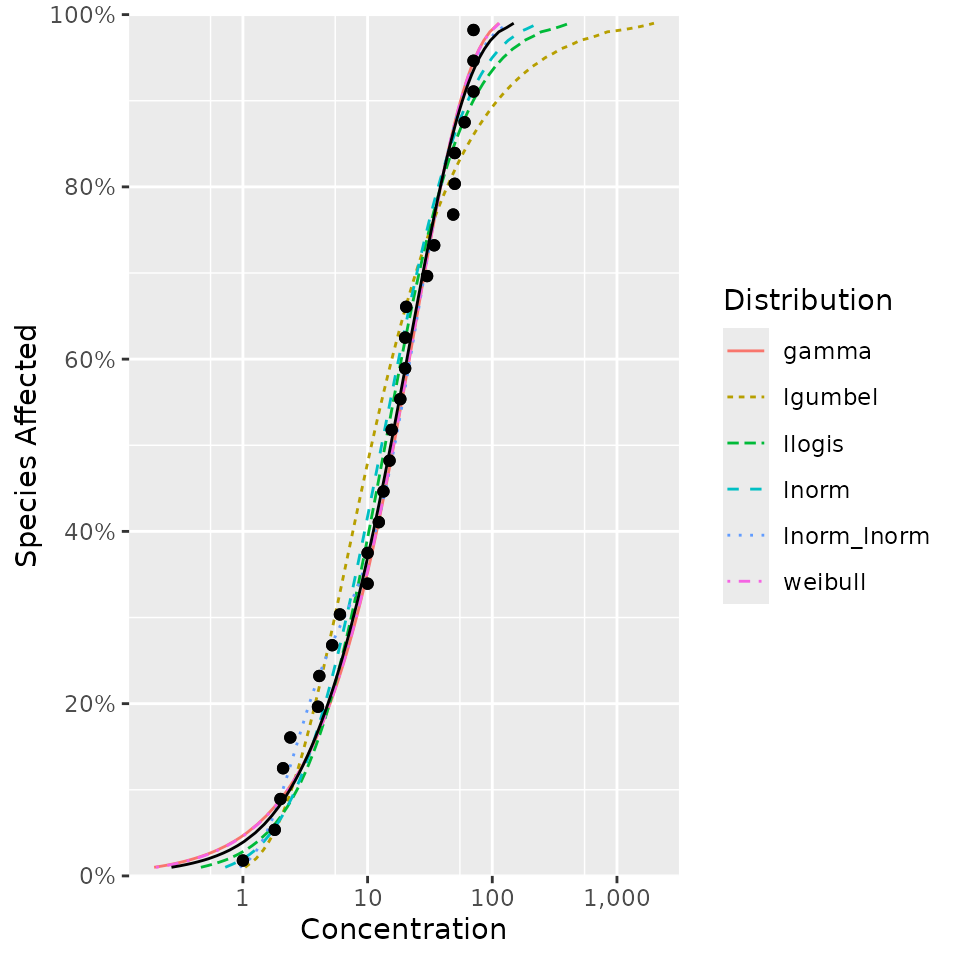
How can I include mathematical expressions in the x-axis label when
using ssd_plot()?
library(ssdtools)

ssd_plot(ssddata::ccme_boron, ssdtools::boron_pred, label = "Species", shape = "Group") +
  ggplot2::scale_x_continuous(latex2exp::TeX("Boron $(\\mu g$/L)$"), breaks = c(1, 10, 100, 1000, 10000))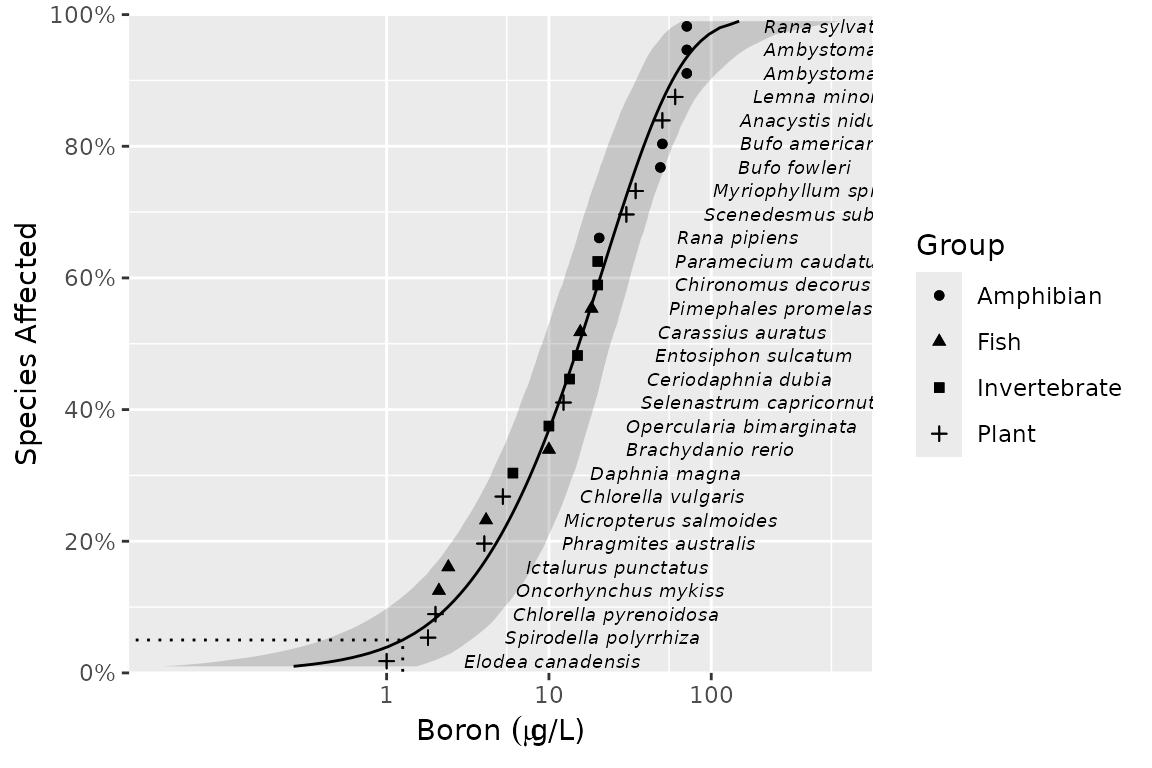
Licensing
Copyright 2015-2023 Province of British Columbia
Copyright 2021 Environment and Climate Change Canada
Copyright 2023-2025 Australian Government Department of Climate Change,
Energy, the Environment and Water
The documentation is released under the CC BY 4.0 License
The code is released under the Apache License 2.0
Censoring
What is censored data?
Data is censored when the exact value is uncertain. There are three primary types of censoring. Right censoring when only the lower bound is known (>), left censoring when only the upper bound is known (<) and interval censored when both the lower and upper bound are known (><). Uncensored data can be thought of as interval censored data in which the upper and lower bound are identical (=). Likewise, missing data can be considered to be censored data in which both the upper and lower bound are unknown (?).
How is censored data coded in ssdtools?
Censored data is coded by specifying the lower bound values in one
column (>) and the upper bound values in a second column (<).
Unknown lower bounds are coded using NA or 0 while unknown upper bounds
are coded using NA or Inf. The name of the columns with the lower and
upper bound values are then passed to the left (>) and
right (<) arguments in the ssd_fit_dists()
function, respectively.
What are the current limitations on analyzing censored data?
Currently ssdtools has the following limitations on the
analysis of censored data:
- model averaging when the distributions have the same number of parameters only; and
- estimation of confidence interval using non-parametric bootstrapping only.