Generic function to plots the cumulative distribution function (CDF).
Usage
ssd_plot_cdf(x, ...)

# S3 method for class 'fitdists'
ssd_plot_cdf(x, average = FALSE, est_method = "multi", delta = 9.21, ...)

# S3 method for class 'list'
ssd_plot_cdf(x, ...)
Arguments
- x
The object.
- ...
Additional arguments passed to
ssd_plot().- average
A flag specifying whether to provide model averaged values as opposed to a value for each distribution or if NA provides model averaged and individual values.
- est_method
A string specifying whether to estimate directly from the model-averaged cumulative distribution function (
est_method = 'multi') or to take the arithmetic mean of the estimates from the individual cumulative distribution functions weighted by the AICc derived weights (est_method = 'arithmetic') or or to use the geometric mean instead (est_method = 'geometric').- delta
A non-negative number specifying the maximum absolute AIC difference cutoff. Distributions with an absolute AIC difference greater than delta are excluded from the calculations.
Methods (by class)
ssd_plot_cdf(fitdists): Plot CDF for fitdists objectssd_plot_cdf(list): Plot CDF for named list of distributional parameter values
Examples
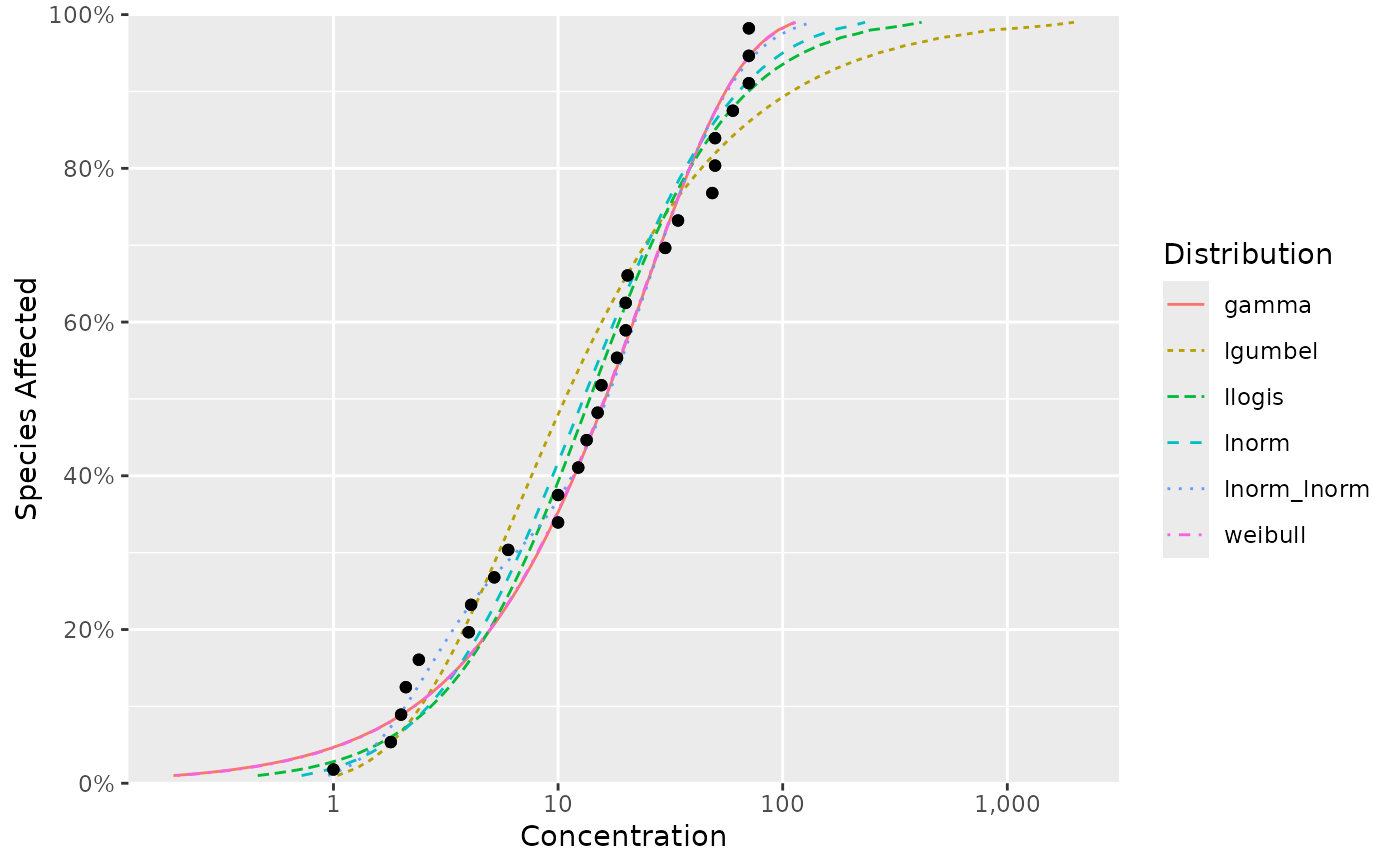
fits <- ssd_fit_dists(ssddata::ccme_boron)
ssd_plot_cdf(fits)
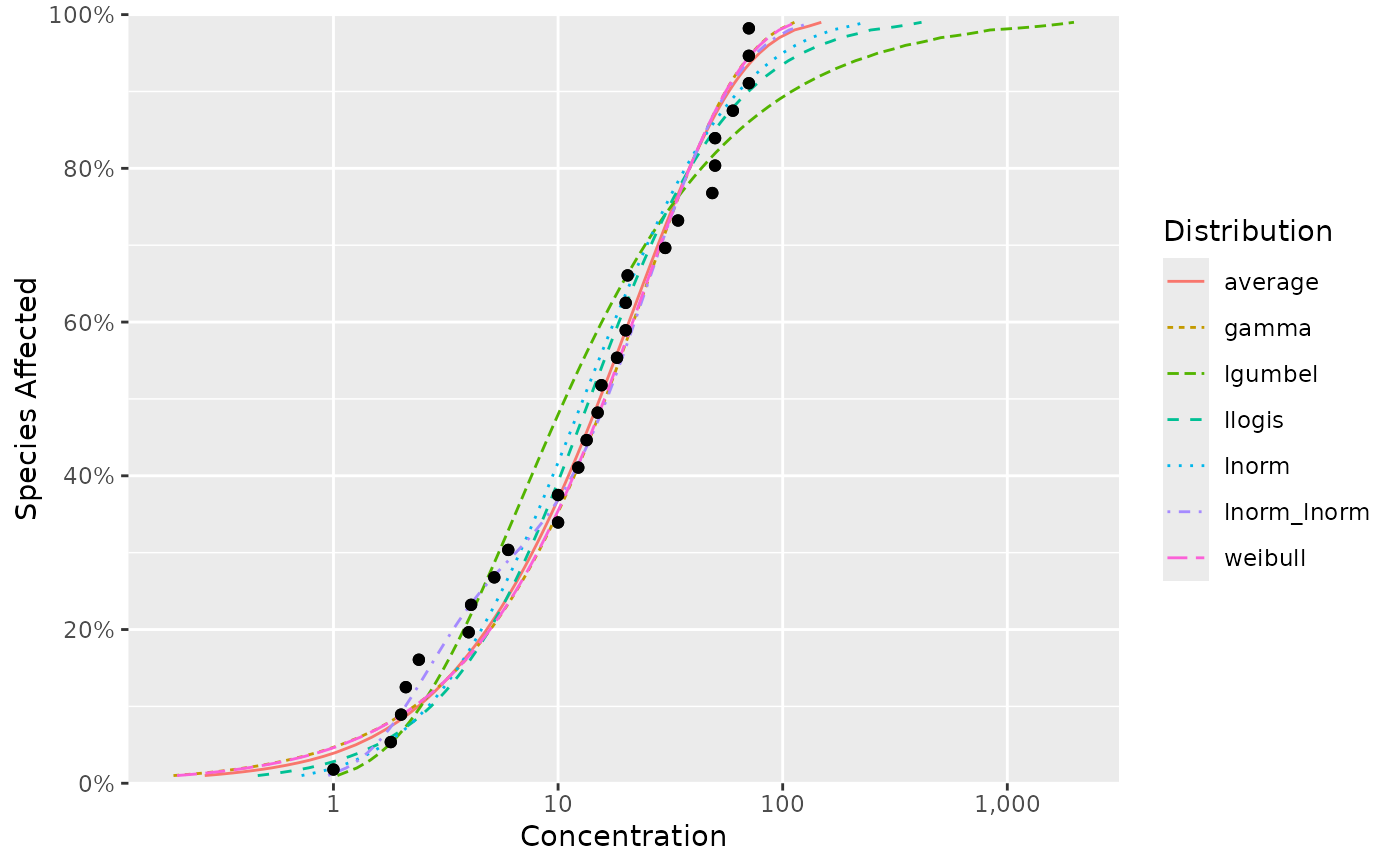
 ssd_plot_cdf(fits, average = NA)
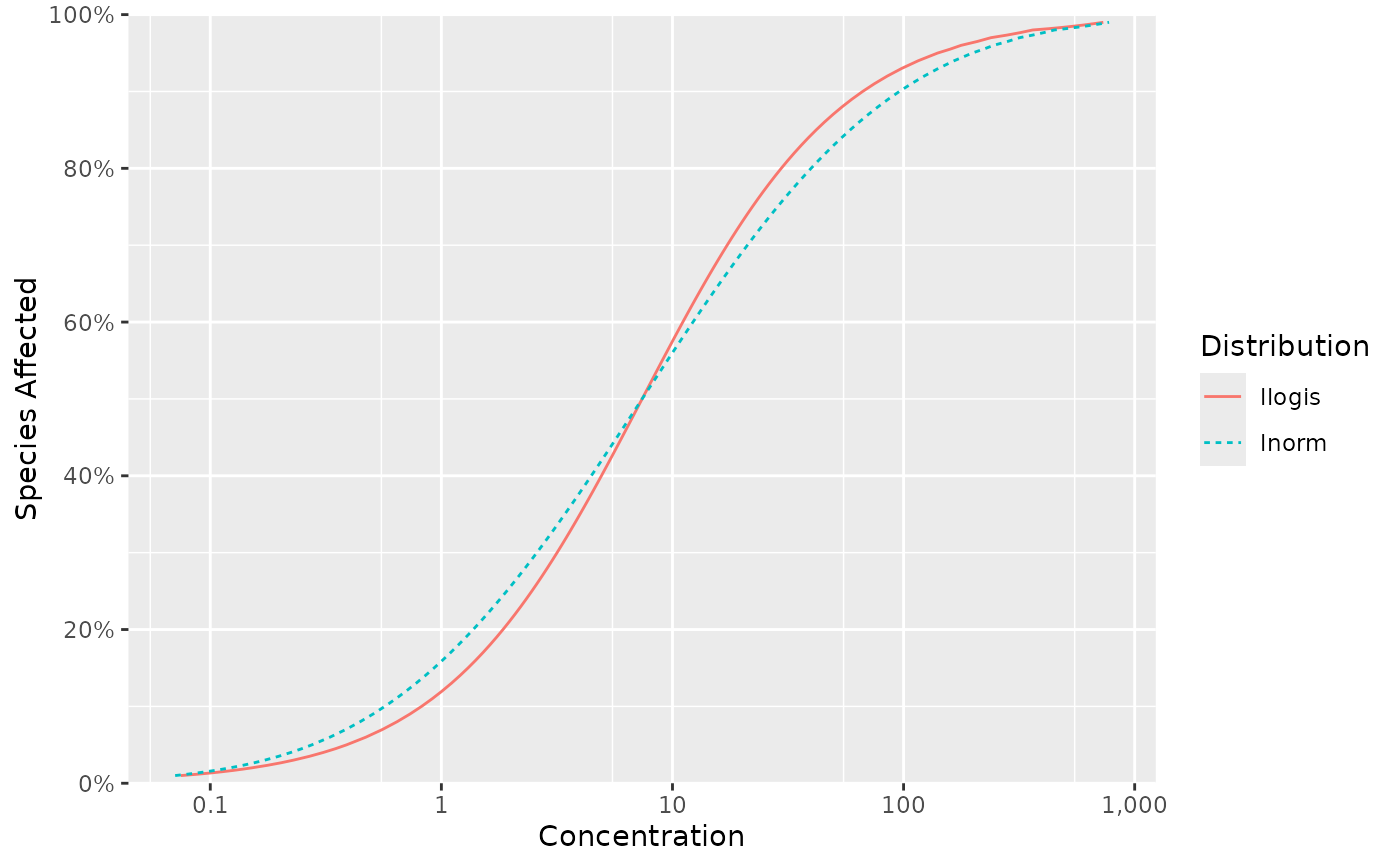
 ssd_plot_cdf(list(
llogis = c(locationlog = 2, scalelog = 1),
lnorm = c(meanlog = 2, sdlog = 2)
))
ssd_plot_cdf(list(
llogis = c(locationlog = 2, scalelog = 1),
lnorm = c(meanlog = 2, sdlog = 2)
))