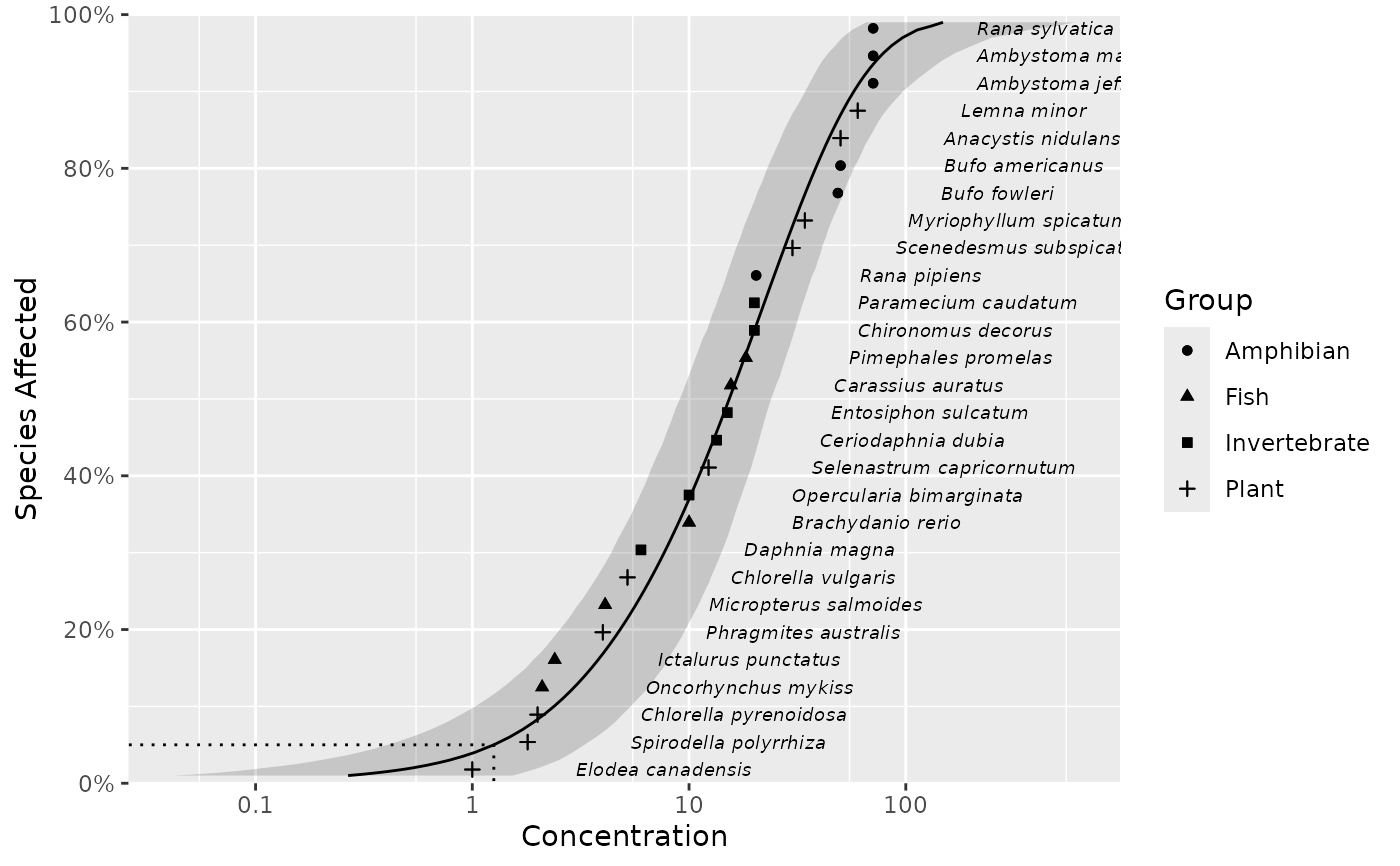
Plots species sensitivity data and distributions.
Usage
ssd_plot(
  data,
  pred,
  left = "Conc",
  right = left,
  ...,
  label = NULL,
  shape = NULL,
  color = NULL,
  size,
  linetype = NULL,
  linecolor = NULL,
  xlab = "Concentration",
  ylab = "Species Affected",
  ci = TRUE,
  ribbon = TRUE,
  hc = 0.05,
  shift_x = 3,
  add_x = 0,
  bounds = c(left = 1, right = 1),
  big.mark = ",",
  decimal.mark = getOption("OutDec", "."),
  suffix = "%",
  trans = "log10",
  xbreaks = waiver(),
  xlimits = NULL,
  text_size = 11,
  label_size = 2.5,
  theme_classic = FALSE
)
Arguments
- data
A data frame.
- pred
A data frame of the predictions.
- left
A string of the column in data with the concentrations.
- right
A string of the column in data with the right concentration values.
- ...
Unused.
- label
A string of the column in data with the labels.
- shape
A string of the column in data for the shape aesthetic.
- color
A string of the column in data for the color aesthetic.
- size
A number for the size of the labels. Deprecated for
label_size. #'![[Deprecated]](figures/lifecycle-deprecated.svg)
- linetype
A string of the column in pred to use for the linetype.
- linecolor
A string of the column in pred to use for the line color.
- xlab
A string of the x-axis label.
- ylab
A string of the x-axis label.
- ci
A flag specifying whether to estimate confidence intervals (by bootstrapping).
- ribbon
A flag indicating whether to plot the confidence interval as a grey ribbon as opposed to green solid lines.
- hc
A value between 0 and 1 indicating the proportion hazard concentration (or NULL).
- shift_x
The value to multiply the label x values by (after adding
add_x).- add_x
The value to add to the label x values (before multiplying by
shift_x).- bounds
A named non-negative numeric vector of the left and right bounds for uncensored missing (0 and Inf) data in terms of the orders of magnitude relative to the extremes for non-missing values.
- big.mark
A string specifying the thousands separator.
- decimal.mark
A string specifying the numeric decimal point.
- suffix
Additional text to display after the number on the y-axis.
- trans
A string of which transformation to use. Accepted values include
"log10","log", and"identity"("log10"by default).- xbreaks
The x-axis breaks as one of:
NULLfor no breakswaiver()for the default breaksA numeric vector of positions
- xlimits
The x-axis limits as one of:
NULLto use the default scale rangeA numeric vector of length two providing the limits. Use NA to refer to the existing minimum or maximum limits.
- text_size
A number for the text size.
- label_size
A number for the size of the labels.
- theme_classic
A flag specifying whether to use the classic theme or the default.
Examples
ssd_plot(ssddata::ccme_boron, boron_pred, label = "Species", shape = "Group")