13 Seeking Help from Others with reprex
If you’re having trouble using a function or package, or getting the syntax correct, 9 times out of 10 the answers you are seeking have already been asked and answered on-line:
- RStudio Community
- Stack Overflow. You can search using the [r] tag.
If you can’t find the answer on-line, there are some on-line forums to seek help from the bcgov R community:
13.1 Help People Help You - reprex
When starting a conversation about code, there are a few things that when included make that conversation more efficient and pleasant for everyone:
- some sample data (preferably provided in the code)
- some code (with comments, white-space, indents
==make it easy to read) - information about your computing environment, like your operating system, version of R, the packages you have loaded
reprex: An R package to help prepare a reproducible example — or reprex — for posting to GitHub issues, StackOverflow, RocketChat snippets, or email and so on.
# install.packages("reprex")

# load libraries we need
library(reprex)
library(readr)
library(dplyr)
library(ggplot2)

# read in data
cats <- read_csv(file = "data/feline-data.csv")

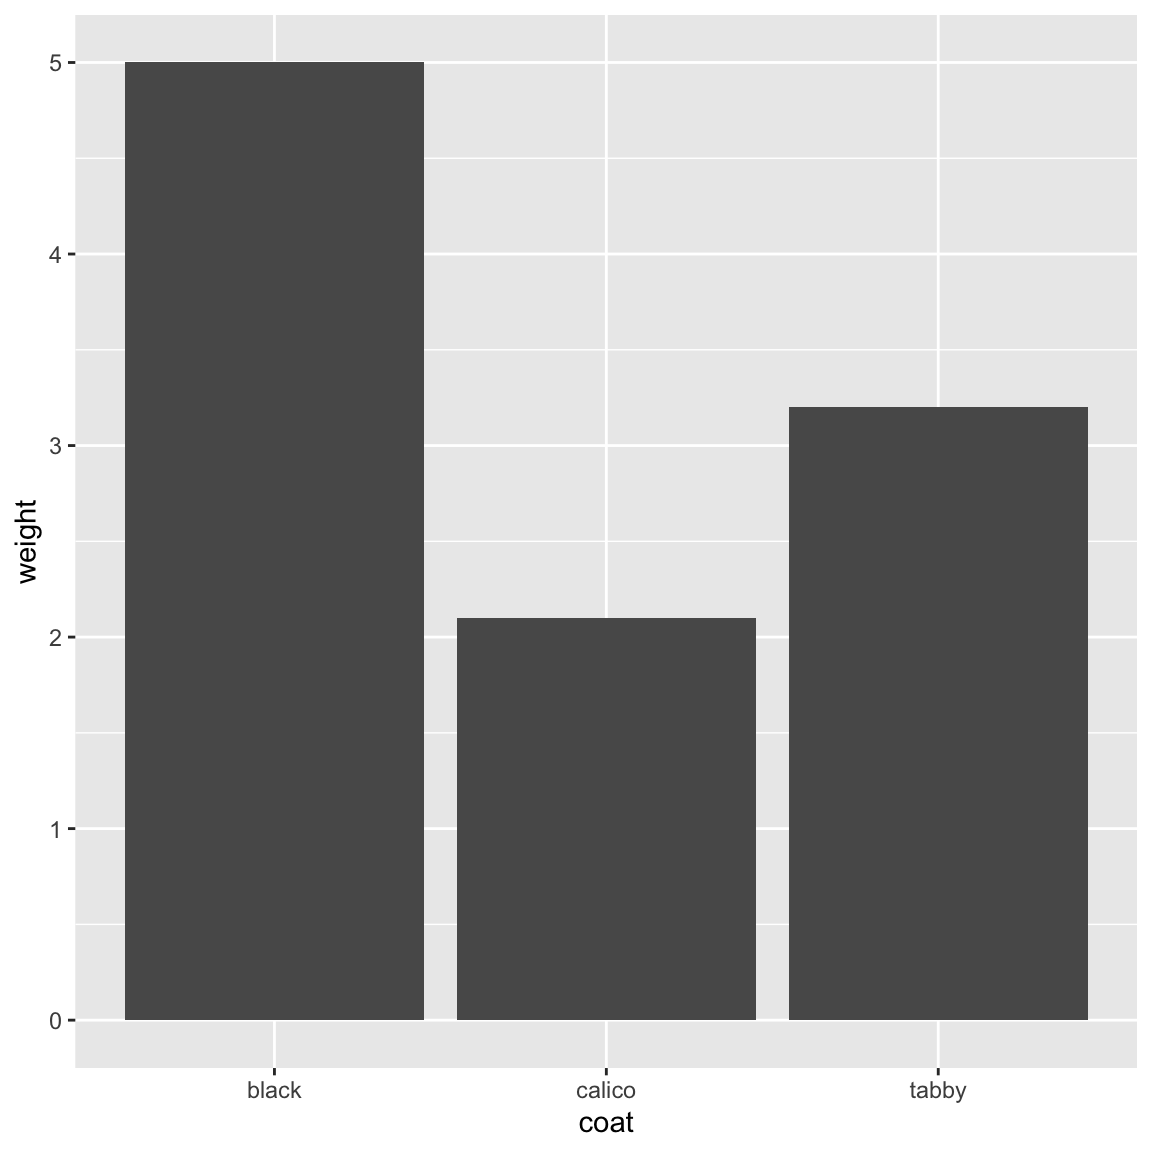
# munge data and make bar plot
cats %>%
  select(coat, weight) %>%
  ggplot(aes(x = coat, y = weight)) +
  geom_col()
# error in syntax - this does not work
cats %>%
  select(coat, weight) %>%
  ggplot(aes(x = coat, y = weight)) %>%
  geom_col()
Error in `geom_col()`:
! `mapping` must be created by `aes()`
ℹ Did you use `%>%` or `|>` instead of `+`?You have read the error message but it was not helpful, you used ?ggplot2, and looked on-line and still cannot find an answer. Maybe someone in the bcgovR community knows?
We need to invest a bit of time making the buggy code shareable – the easier it is for someone to run the code, the easier – and likely faster – someone might be able to provide some help.

If the data is shareable (e.g. available in the B.C. Data Catalogue with appropriate licence, publicly available) then we can use dput():
# use dput to make data set with code
dput(cats)
structure(list(coat = c("calico", "black", "tabby"), weight = c(2.1,
5, 3.2), likes_string = c(1, 0, 1)), row.names = c(NA, -3L), spec = structure(list(
cols = list(coat = structure(list(), class = c("collector_character",
"collector")), weight = structure(list(), class = c("collector_double",
"collector")), likes_string = structure(list(), class = c("collector_double",
"collector"))), default = structure(list(), class = c("collector_guess",
"collector")), delim = ","), class = "col_spec"), problems = <pointer: 0x6000022bd380>, class = c("spec_tbl_df",
"tbl_df", "tbl", "data.frame"))
cats <- structure(list(coat = c("calico", "black", "tabby"), weight = c(2.1,
5, 3.2), likes_string = c(1, 0, 1)), class = c("spec_tbl_df",
"tbl_df", "tbl", "data.frame"), row.names = c(NA, -3L), spec = structure(list(
    cols = list(coat = structure(list(), class = c("collector_character",
    "collector")), weight = structure(list(), class = c("collector_double",
    "collector")), likes_string = structure(list(), class = c("collector_double",
    "collector"))), default = structure(list(), class = c("collector_guess",
    "collector")), skip = 1), class = "col_spec"))

# error in syntax - this does not work
cats %>%
  select(coat, weight) %>%
  ggplot(aes(x = coat, y = weight)) %>%
  geom_col()
Error in `geom_col()`:
! `mapping` must be created by `aes()`
ℹ Did you use `%>%` or `|>` instead of `+`?dput() will dump the data you’re working with into a format so that it can
be copy and pasted by anyone else into their R session.
If the data is not shareable, you can use some built in data and re-create the issue:
# ?datasets # built in datasets
# ?starwars # ships with dplyr

# View(starwars)

# error in syntax - this does not work
starwars %>%
  select(name, height) %>%
  ggplot(aes(x = name, y = height)) %>%
  geom_col()
Error in `geom_col()`:
! `mapping` must be created by `aes()`
ℹ Did you use `%>%` or `|>` instead of `+`?Once the code is ready for sharing, select the code and use reprex_selection() or the clickable RStudio Addin Reprex selection button to copy the formatted code to the clipboard for sharing on-line (demonstrated).
Sometimes it is useful to share information about your computing environment as well:
R version 4.2.2 (2022-10-31)
Platform: x86_64-apple-darwin17.0 (64-bit)
Running under: macOS Big Sur ... 10.16

Matrix products: default
BLAS:   /Library/Frameworks/R.framework/Versions/4.2/Resources/lib/libRblas.0.dylib
LAPACK: /Library/Frameworks/R.framework/Versions/4.2/Resources/lib/libRlapack.dylib

locale:
[1] en_US.UTF-8/en_US.UTF-8/en_US.UTF-8/C/en_US.UTF-8/en_US.UTF-8

attached base packages:
[1] stats     graphics  grDevices utils     datasets  methods   base

other attached packages:
[1] ggplot2_3.4.0 dplyr_1.0.10  readr_2.1.3   reprex_2.0.2  knitr_1.41

loaded via a namespace (and not attached):
 [1] highr_0.10       bslib_0.4.2      compiler_4.2.2   pillar_1.8.1
 [5] jquerylib_0.1.4  tools_4.2.2      bit_4.0.5        digest_0.6.31
 [9] downlit_0.4.2    gtable_0.3.1     jsonlite_1.8.4   evaluate_0.20
[13] memoise_2.0.1    lifecycle_1.0.3  tibble_3.1.8     pkgconfig_2.0.3
[17] rlang_1.0.6      DBI_1.1.3        cli_3.6.0        parallel_4.2.2
[21] yaml_2.3.7       xfun_0.36        fastmap_1.1.0    withr_2.5.0
[25] stringr_1.5.0    xml2_1.3.3       generics_0.1.3   fs_1.6.0
[29] sass_0.4.4       vctrs_0.5.2      hms_1.1.2        bit64_4.0.5
[33] grid_4.2.2       tidyselect_1.2.0 glue_1.6.2       R6_2.5.1
[37] fansi_1.0.4      vroom_1.6.1      rmarkdown_2.20   bookdown_0.32
[41] farver_2.1.1     tzdb_0.3.0       magrittr_2.0.3   scales_1.2.1
[45] htmltools_0.5.4  ellipsis_0.3.2   assertthat_0.2.1 colorspace_2.1-0
[49] labeling_0.4.2   utf8_1.2.2       stringi_1.7.12   munsell_0.5.0
[53] cachem_1.0.6     crayon_1.5.2
sessionInfo() will print out your current version of R, as well as any packages you
have loaded. This can be useful to help reproduce and debug
your issue.