import bcdata
bcdata.__version__'0.16.0post1'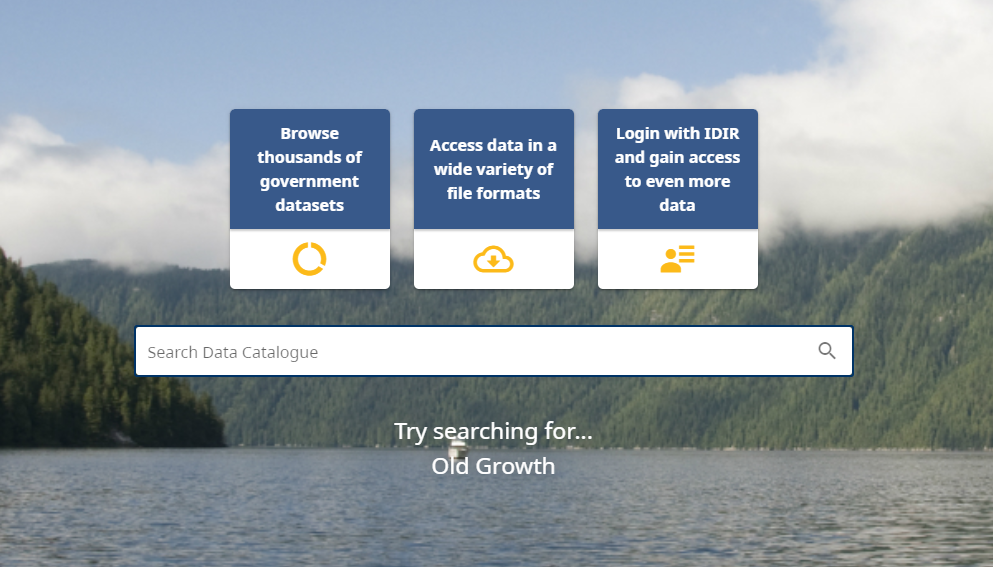
B.C. Data Catalogue
The British Columbia government hosts over 2000 tabular and geospatial data sets in the B.C. Data Catalogue. Most data is available through the B.C. Data Catalogue under an open licence. The bcdata package provides a programming interface to the geospatial data sets of the B.C. Data Catalogue. This allows Python users to import data directly from the B.C. Data Catalogue into their Python session. Through this functionality the bcdata package connects British Columbia government public data holdings in the B.C. Data Catalogue with the vast capabilities of Python.
Unlike the rest of the packages we have downloaded (using conda commands), the bcdata package is not available for download via conda (this is often the case for smaller packages that are not widely distributed globally). This is one of those instances where we need to mix our use of pip and conda. However, the installation process proceeds in the same fashion as before. These commands can be done from an anaconda prompt, or from the command prompt (cmd) utility inside VS Code.
Anaconda Prompt
> conda activate ds-env
> pip install bcdata
As before, make sure that you are installing this package in the ds-env environment! To make sure that this has successfully downloaded, we can try importing it into our Python session.
import bcdata
bcdata.__version__'0.16.0post1'To use the bcdata package, we will need to familiarize ourselves with the B.C. Data Catalogue. If we enter a search term in the catalogue, it will bring up a variety of data sets that might meet our needs. However, the python bcdata package is only for geospatial datsets. These will typically be data types with a resource storage format (one of the filter options) that matches:
If we filter to only include these options for the format, we will find some geospatial datasets. Let’s try looking for a list of the locations of all B.C. emergency rooms.
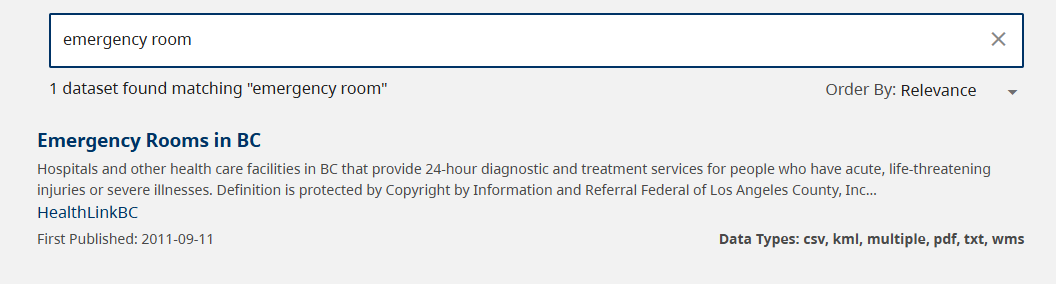
B.C. Emergency Rooms
The first search result here, Emergency Rooms in BC, looks like it might be what we are looking for. If we click on it, we see that there are options for geographic downloads on the right hand side of the page. This is good - it means that we have found a geographic dataset!
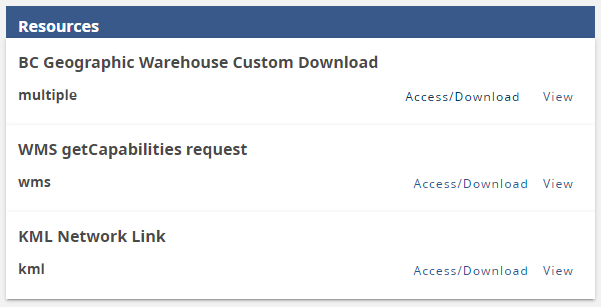
Geographic Download Options
If we now click on the View button beside the BC Geographic Warehouse Custom Download resource, we will get some more information about the dataset. This includes details such as how frequently the dataset is refreshed, when it was last refreshed, the type of geometry used, the details of the columns included in the data and more.
At this point in a ‘pre-programming’ world, we would have to request to access/download the dataset, wait for the file to arrive, store it locally in a folder we hopefully don’t misplace, and then find some tool capable of viewing the data. While each of these steps individually is not terribly difficult, putting them altogther, and documenting the entire process can be prohibitive and mistake prone. What if we forget where we stored the file? Or forget which file we were using when we need to refresh the dataset? When datasets are acquired manually like this, having a reproducible workflow becomes so much more difficult!
In a python world, all of these steps can be done directly within a single script! This essentially guarantees the reproducibility and transparency of the workflow.
Okay, we have a geospatial dataset in mind, now what? First, we will call on the bcdata package to import our chosen dataset into python. To do this, we need to use the get_data() method, and use 2 arguments:
dataset: this is the name of the dataset we wish to pull from the catalog. This can be either the id or Object Name:
id: last portion of the URL - in this case ‘emergency-rooms-in-bc’Object Name: under Object Description - in this case ‘WHSE_IMAGERY_AND_BASE_MAPS.GSR_EMERGENCY_ROOMS_SV’as_gdf: a boolean argument that specifies to load the data into a geopandas DataFrame (a specialized pandas dataframe capable of holding geospatial data)
Let’s go ahead and use these arguments to pull the dataset into Python!
emerg_rooms = bcdata.get_data(
    dataset='emergency-rooms-in-bc',
    as_gdf=True
    )
emerg_rooms.head()| geometry | ORGANIZATION_NAME | SERVICE_REF | SERVICE_NAME | DESCRIPTION | CONTACT_PHONE | WEBSITE_URL | CONTACT_EMAIL | WHEELCHAIR_ACCESSIBLE_IND | HOURS_OF_OPERATION | ... | LOCALITY | PROVINCE | POSTAL_CODE | WEBSITE_HEALTHLINKBC_URL | KEYWORDS | LATITUDE | LONGITUDE | DATE_UPDATED | OBJECTID | SE_ANNO_CAD_DATA | |
|---|---|---|---|---|---|---|---|---|---|---|---|---|---|---|---|---|---|---|---|---|---|
| 0 | POINT (1209577.872 474154.885) | BC Children's Hospital | 17643949 | Emergency Health Services | Provides emergency medical care for children u... | 6048752045 | http://www.bcchildrens.ca/our-services/hospita... | None | Y | 24 hours a day, 7 days a week | ... | Vancouver | BC | V6H 3V4 | http://www.healthlinkbc.ca/find/resource.asp?F... | Emergency Room Care | 49.245414 | -123.123581 | 2026-07-14Z | 120 | None |
| 1 | POINT (1269788.264 453898.661) | Fraser Health Authority | 17645045 | Emergency Health Services | Provides 24-hour emergency services for patien... | 6048514700 | https://www.fraserhealth.ca/patients-and-visit... | None | Y | 24 hours a day, 7 days a week | ... | Abbotsford | BC | V2S 0C2 | http://www.healthlinkbc.ca/find/resource.asp?F... | Emergency Room Care | 49.038152 | -122.313003 | 2026-07-14Z | 190 | None |
| 2 | POINT (1230396.964 467435.128) | Fraser Health Authority | 17645045 | Emergency Health Services | Provides 24-hour emergency services for patien... | 6045812211 | https://www.fraserhealth.ca/patients-and-visit... | None | Y | 24 hours a day, 7 days a week | ... | Surrey | BC | V3V 1Z2 | http://www.healthlinkbc.ca/find/resource.asp?F... | Emergency Room Care | 49.177003 | -122.842316 | 2026-07-14Z | 230 | None |
| 3 | POINT (1294606.618 469450.752) | Fraser Health Authority | 17645045 | Emergency Health Services | Provides 24-hour emergency services for patien... | 6047954141 | https://www.fraserhealth.ca/patients-and-visit... | None | Y | 24 hours a day, 7 days a week | ... | Chilliwack | BC | V2P 1P7 | http://www.healthlinkbc.ca/find/resource.asp?F... | Emergency Room Care | 49.165763 | -121.962422 | 2026-07-14Z | 162 | None |
| 4 | POINT (1332301.279 495250.068) | Fraser Health Authority | 17645045 | Emergency Health Services | Provides 24-hour emergency services for patien... | 6048695656 | https://www.fraserhealth.ca/patients-and-visit... | None | Y | 24 hours a day, 7 days a week | ... | Hope | BC | V0X 1L4 | http://www.healthlinkbc.ca/find/resource.asp?F... | Emergency Room Care | 49.376899 | -121.424345 | 2026-07-14Z | 192 | None |
5 rows × 21 columns
Success! We have our data. Notice, in particular that we have a column called geometry. This is a special column for spatial datasets that will hold different types of geography depending on what the dataset is. In this case, we have specific locations of hospitals, so the geometry is a list of point objects that contain latitude/longitude coordinates.
Let’s try a different dataset that will give us area geometries. Area geometries will show up as ‘(multi)polygons’ in the datset, meaning that they are a list of points that define the boundary of some area. This could be school district boundaries, health authority areas, or any other region we might be interested in. For fun, let’s look at the B.C. Wildfire Fire Zones.
It might be the case that the data we wish to access is only a subset of the overall dataset. While we could filter the data after it comes into python, it might be faster, more efficient, or simply be less of a memory hog if we filter it before it comes into our session. In this case, we can add the optional query argument when we fetch the data. We can supply a string to this argument that will act like a simple SQL ‘where’ clause. As an example, let’s filter the emergency room dataset to include only those in Vancouver:
er_filtered = bcdata.get_data(
    dataset='emergency-rooms-in-bc',
    as_gdf=True,
    query="LOCALITY='Vancouver'"
)
er_filtered.head()| geometry | ORGANIZATION_NAME | SERVICE_REF | SERVICE_NAME | DESCRIPTION | CONTACT_PHONE | WEBSITE_URL | CONTACT_EMAIL | WHEELCHAIR_ACCESSIBLE_IND | HOURS_OF_OPERATION | ... | LOCALITY | PROVINCE | POSTAL_CODE | WEBSITE_HEALTHLINKBC_URL | KEYWORDS | LATITUDE | LONGITUDE | DATE_UPDATED | OBJECTID | SE_ANNO_CAD_DATA | |
|---|---|---|---|---|---|---|---|---|---|---|---|---|---|---|---|---|---|---|---|---|---|
| 0 | POINT (1209577.872 474154.885) | BC Children's Hospital | 17643949 | Emergency Health Services | Provides emergency medical care for children u... | 6048752045 | http://www.bcchildrens.ca/our-services/hospita... | None | Y | 24 hours a day, 7 days a week | ... | Vancouver | BC | V6H 3V4 | http://www.healthlinkbc.ca/find/resource.asp?F... | Emergency Room Care | 49.245414 | -123.123581 | 2026-07-14Z | 120 | None |
| 1 | POINT (1200706.459 475943.147) | Vancouver Coastal Health | 17649851 | Emergency Health Services | Provides 24-hour emergency health care and tra... | 6048227121 | https://www.vch.ca/en/location-service/emergen... | None | Y | Mon 08:00 - 20:00; Tue 08:00 - 20:00; Wed 08:0... | ... | Vancouver | BC | V6T 2B5 | http://www.healthlinkbc.ca/find/resource.asp?F... | Emergency Room Care | 49.264671 | -123.244259 | 2026-07-14Z | 278 | None |
| 2 | POINT (1209436.665 475994.323) | Vancouver Coastal Health | 17649905 | Emergency Health Services - Vancouver | Provides a full range of basic and highly spec... | 6048754111 | https://www.vch.ca/en/location-service/emergen... | None | Y | Open 24 hours, 7 days a week | ... | Vancouver | BC | V5Z 1M9 | http://www.healthlinkbc.ca/find/resource.asp?F... | Emergency Room Care | 49.262007 | -123.124492 | 2026-07-14Z | 302 | None |
| 3 | POINT (1209031.012 478047.04) | Providence Health Care Society | 17654692 | Emergency Health Services | Provides emergency health care services for Va... | 6046822344 | https://www.providencehealthcare.org/en/emergency | None | Y | 24 hours a day, 7 days a week | ... | Vancouver | BC | V6Z 1Y6 | http://www.healthlinkbc.ca/find/resource.asp?F... | Emergency Room Care | 49.280614 | -123.128913 | 2026-07-14Z | 298 | None |
| 4 | POINT (1211504.28 475599.698) | Providence Health Care Society | 17654692 | Emergency Health Services | Provides emergency health care services for Va... | 6048741141 | https://www.providencehealthcare.org/en/emergency | None | Y | Mon 08:00 - 20:00; Tue 08:00 - 20:00; Wed 08:0... | ... | Vancouver | BC | V5T 3N4 | http://www.healthlinkbc.ca/find/resource.asp?F... | Emergency Room Care | 49.257699 | -123.096358 | 2026-07-14Z | 156 | None |
5 rows × 21 columns
In the query above, note that the column in the query is NOT put in an extra set of quotations, whereas the column value is for character columns. This is in line with standard SQL syntax, but if you are not familiar with SQL then it might look a little confusing at first! General rule of thumb for the query is that it will be something of the form:
"COLUMN_A = 'some string value' OR COLUMN_B = 42"
Alright, we have some geospatial data in Python now. That’s great. I really love
POLYGON ((-118.37713213 49.91303648, -118.37772348 49.91308665, -118.37819007 49.91293438, -118.37864102 49.91273297, -118.37885065 49.91240661, -118.37894791 49.91201733, -118.3791819 49.91159333, -118.37960692 49.91128489, -118.3800468 49.91108959, -118.38056154 49.91089751, -118.38113866 49.91078258, -118.38179033 49.91067428, -118.38237742 49.91061745, -118.38289869 49.91056691, -118.38332771 49.91048198, -118.38381897 49.91036744, -118.38447835 49.91018407, -118.38517458 49.91007327, -118.38585128 49.91001193, -118.38650275 49.90998635, -118.38735549 49.90993369, -118.38790802 49.90991568, -118.38842369 49.90990548, -118.38892747 49.90988955, -118.38972597 49.90985294, -118.39035971 49.90986504, -118.39098773 49.9099297, -118.39161337 49.90996627, -118.39214558 49.91004415, -118.39273105 49.91006478, -118.3932995 49.90999734, -118.39412967 49.90993219, -118.39464161 49.90987966, -118.39535483 49.90980076, -118.39601118 49.90972691, …)
this time of year, don’t you?
… no? No clue where that is or what it might look like? Me neither. Luckily for us, we can checkout these datasets with some geospatial plots! The geopandas dataframe that the data was loaded into can automatically display a map with points, borders, or coloured regions.
Let’s look at the basic plot that is displayed for a ‘point’ style geometry vs. a ‘polygon’ style geometry. Don’t forget to import matplotlib to display the plots!
import matplotlib.pyplot as plt

emerg_rooms.plot()
plt.show()

fires.plot()
plt.show()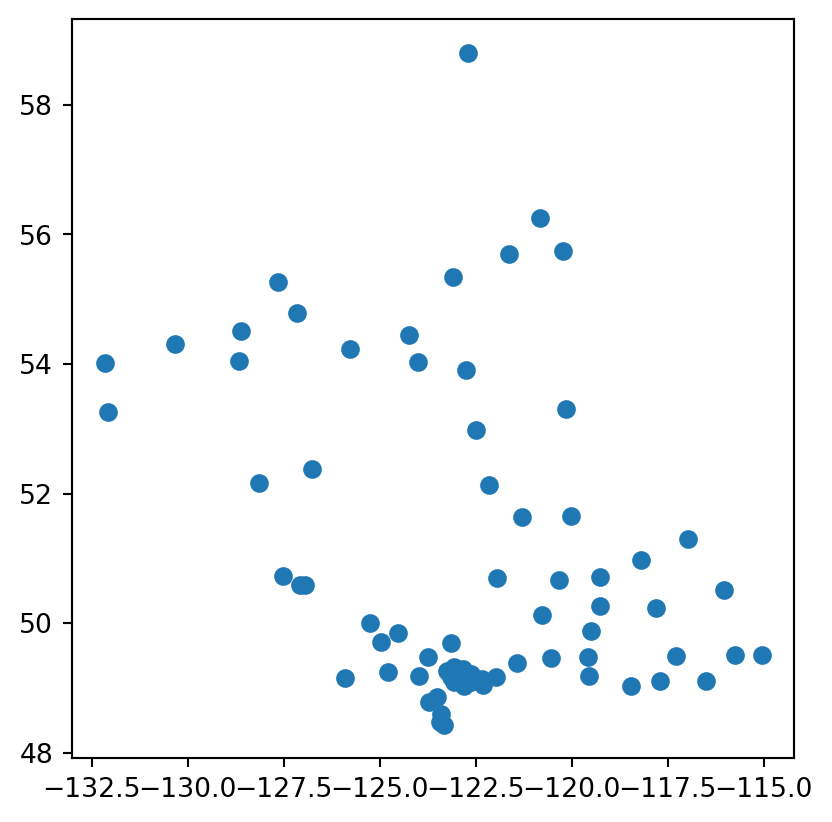
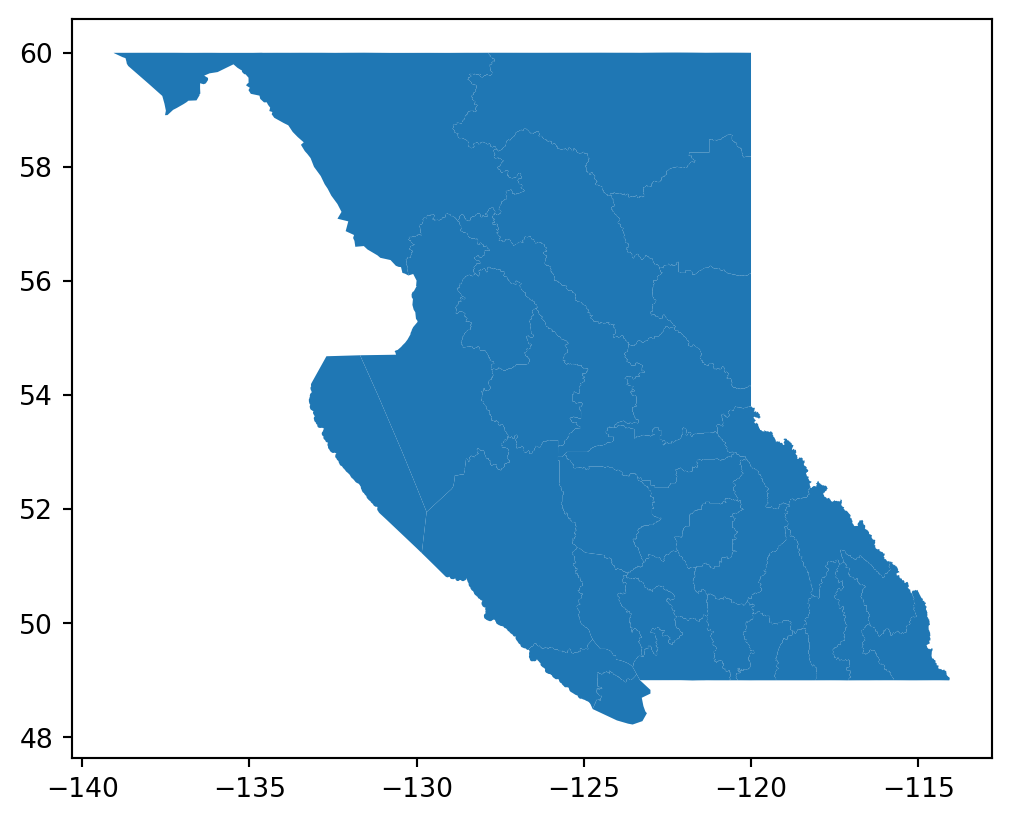
Way better! With polygon areas, we also have a few more options for how we wish to colour the regions.
We can colour based on a categorical variable:
fires.plot(column='MOF_FIRE_CENTRE_NAME')
plt.show()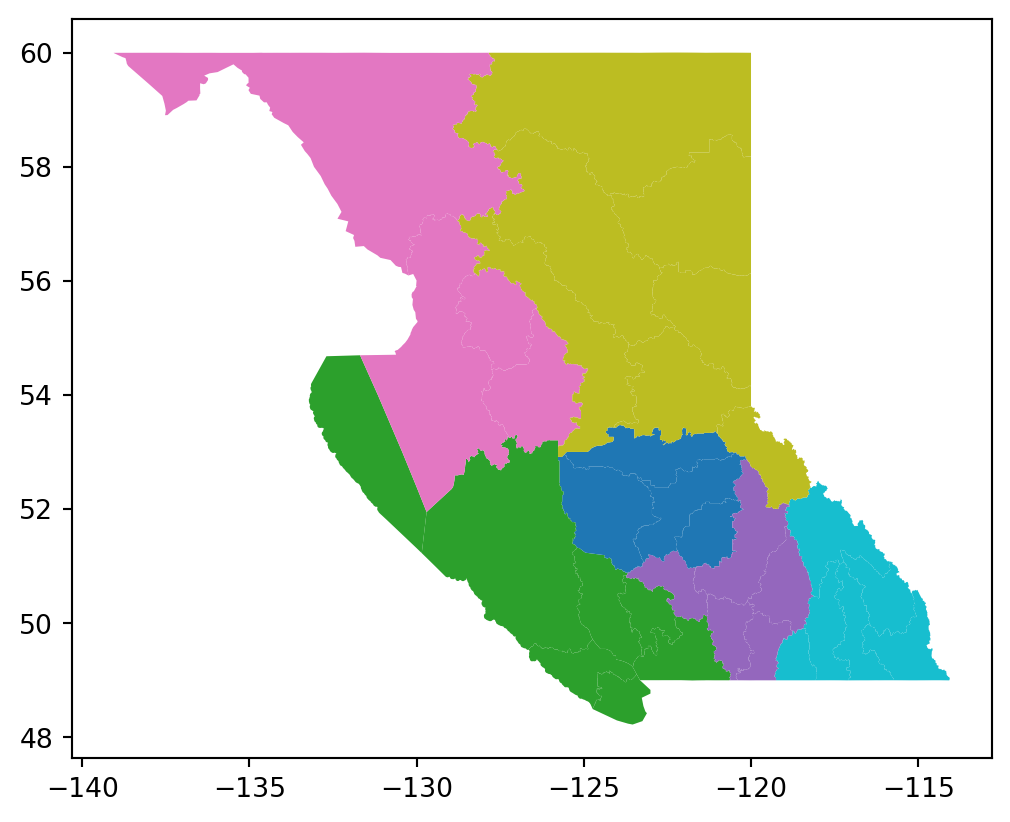
Or on a numerical variable:
fires.plot(column='FEATURE_AREA_SQM', legend=True)
plt.show()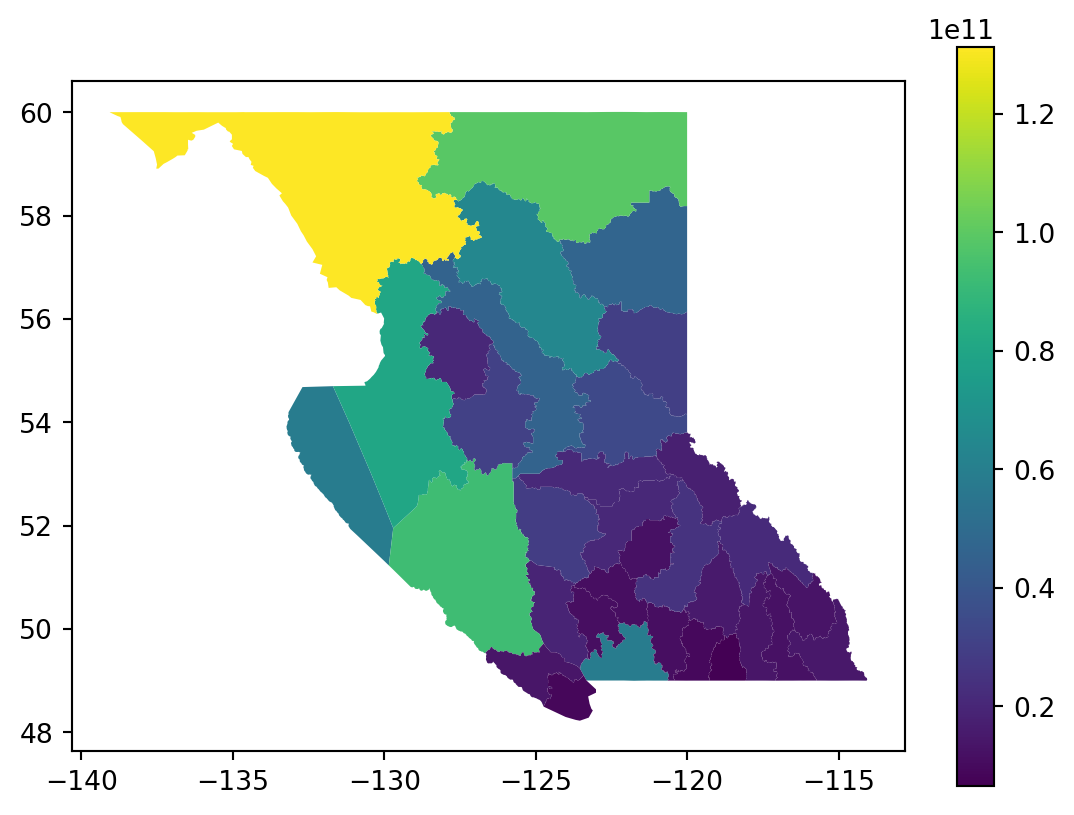
Or if we only want to display the boundaries of our regions, we can do that too:
fires.boundary.plot()
plt.show()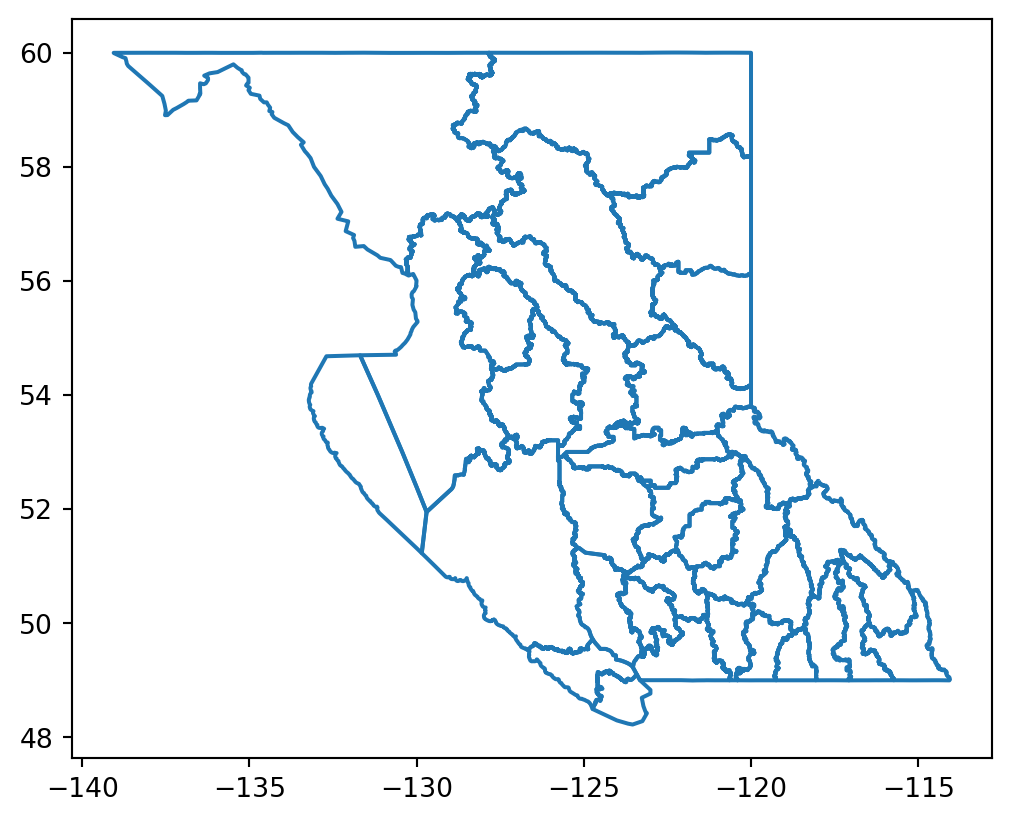
You’ll notice that we can easily see the shape of B.C. in these region plots, but it is less obvious for the emergency rooms dataset. Because the emergency rooms dataset only contains ‘point’ objects, it will just place these points on an axis, but with no region boundaries to reference, it might just look like a scattering of points on a plot.
Luckily, we can combine our region plot and point plot to give context to point locations. Because the underlying plotting tools used by these dataframes is matplotlib, we can plot both plots to the same axes before showing the overall figure!
ax = fires.boundary.plot()  # assign the output of this first plot to a variable

emerg_rooms.plot(
    ax=ax, # use the output of the first plot as the basis for the next
    marker='.',  # apply some styling options
    color='red'
    )

# use the axis again later to turn off the annoying axis labels
# we don't always want/need those for geospatial plots!
ax.set_axis_off()

# display your work!
plt.show()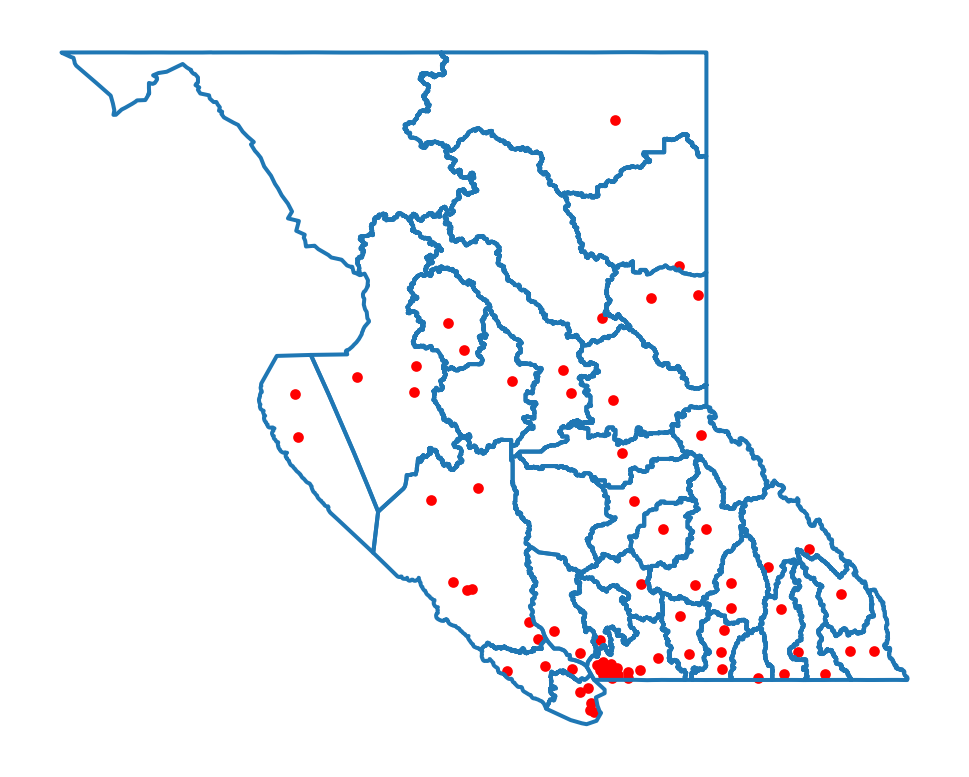
We were able to plot these two spatial datasets together because they were imported into python using the same Coordinate Reference System (CRS). The CRS tells the polygon or point shapes how to relate to actual physical locations on Earth. On the B.C. Catalogue Reference Page for both datasets, the spatial reference system is given as EPSG:3005 - NAD83/BC Albers.
We can check what the CRS is for a given dataset in Python by looking at the geometry series:
display(emerg_rooms['geometry'].crs)
display(fires['geometry'].crs)
<Projected CRS: EPSG:3005>
Name: NAD83 / BC Albers
Axis Info [cartesian]:
- E[east]: Easting (metre)
- N[north]: Northing (metre)
Area of Use:
- name: Canada - British Columbia.
- bounds: (-139.04, 48.25, -114.08, 60.01)
Coordinate Operation:
- name: British Columbia Albers
- method: Albers Equal Area
Datum: North American Datum 1983
- Ellipsoid: GRS 1980
- Prime Meridian: Greenwich<Projected CRS: EPSG:3005>
Name: NAD83 / BC Albers
Axis Info [cartesian]:
- E[east]: Easting (metre)
- N[north]: Northing (metre)
Area of Use:
- name: Canada - British Columbia.
- bounds: (-139.04, 48.25, -114.08, 60.01)
Coordinate Operation:
- name: British Columbia Albers
- method: Albers Equal Area
Datum: North American Datum 1983
- Ellipsoid: GRS 1980
- Prime Meridian: GreenwichIf for some reason, the two spatial datasets do not have the same reference system, the geopandas dataset gives an option for converting one CRS to another:
my_geoseries = my_geoseries.to_crs("EPSG:4326")
my_geoseries = my_geoseries.to_crs(epsg=4326)
Well there you have it. You can find more information on making geopandas plots here, as well as more information on the bcdata package here. We know that this is a much more technical topic than some of the previous sections, but hopefully it will get you excited about all the new ways of exploring data that python allows us to explore!