The functions were designed for coloring different groups in a plot of SSD data.
Arguments
- ...
Arguments passed to
ggplot2::discrete_scale().
Functions
scale_color_ssd(): Discrete color-blind scale for SSD Plotsscale_fill_ssd(): Discrete color-blind scale for SSD Plots
See also
Other ggplot:
geom_hcintersect(),
geom_ssdpoint(),
geom_ssdsegment(),
geom_xribbon(),
ssd_pal()
Examples
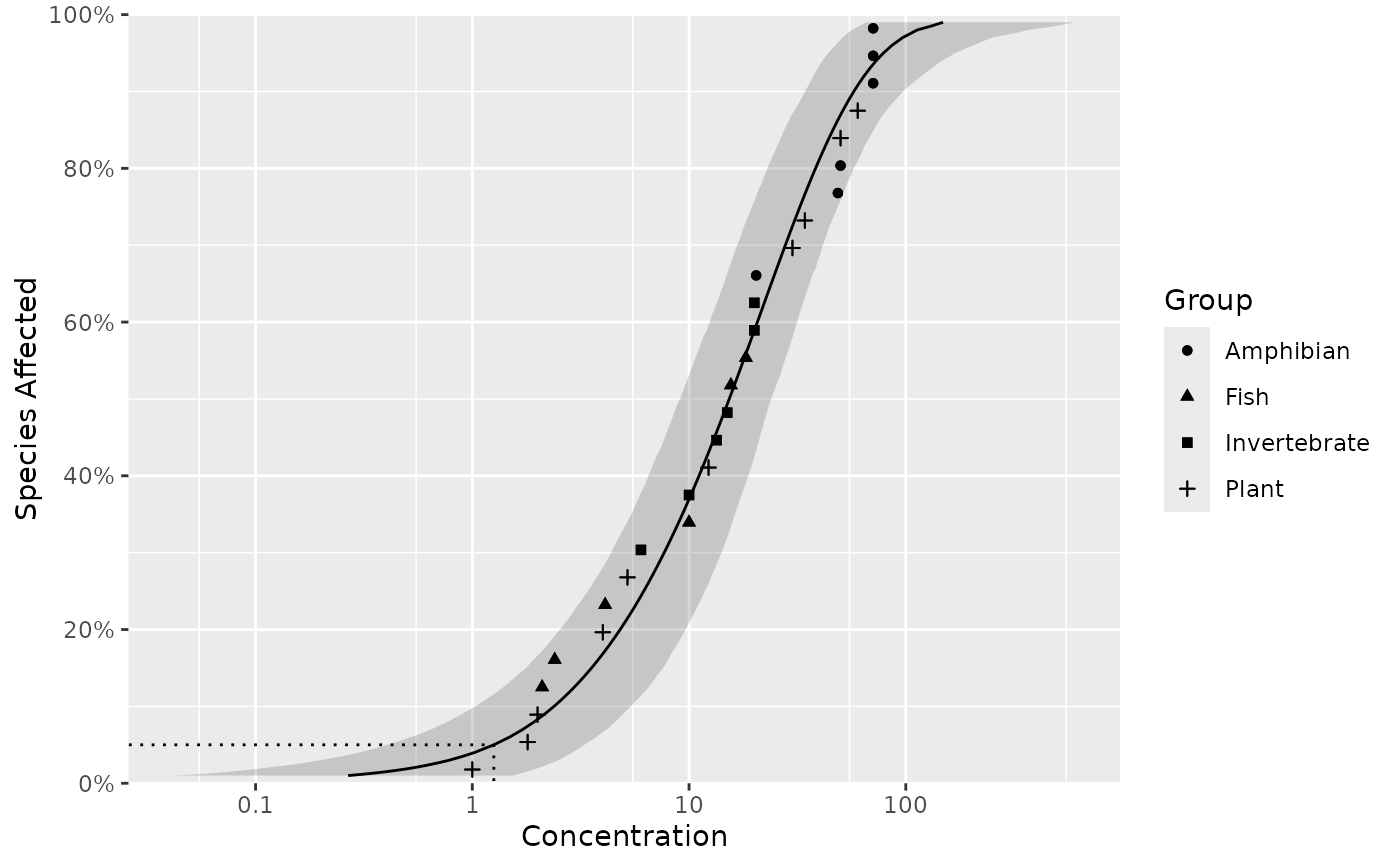
# Use the color-blind palette for a SSD plot
ssd_plot(ssddata::ccme_boron, boron_pred, shape = "Group", color = "Group") +
scale_colour_ssd()
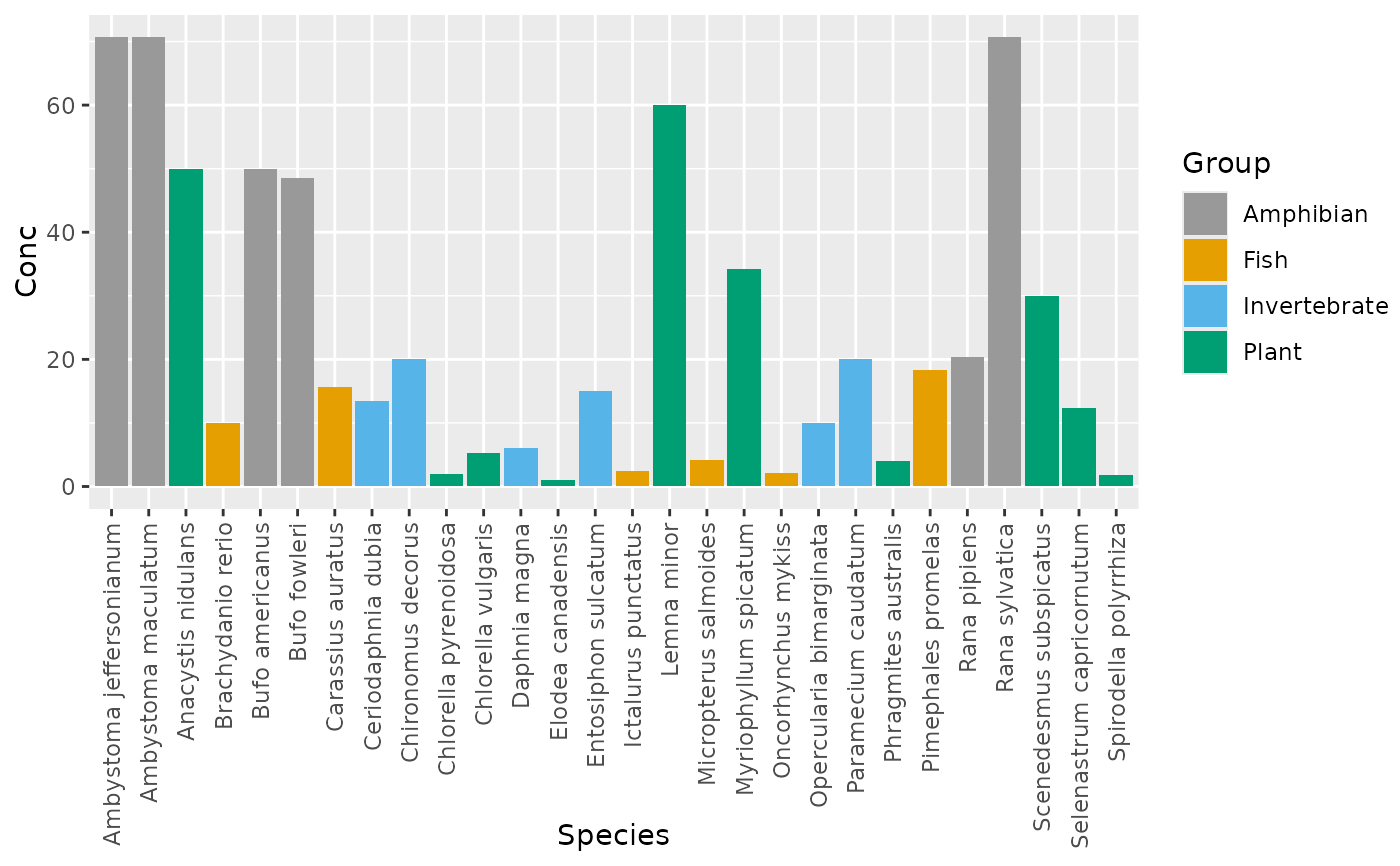
 # Use the color-blind palette for a histogram of concentrations
ggplot2::ggplot(ssddata::ccme_boron, ggplot2::aes(x = Species, y = Conc, fill = Group)) +
ggplot2::geom_col() +
scale_fill_ssd() +
ggplot2::theme(axis.text.x = ggplot2::element_text(angle = 90, vjust = 0.5, hjust = 1))
# Use the color-blind palette for a histogram of concentrations
ggplot2::ggplot(ssddata::ccme_boron, ggplot2::aes(x = Species, y = Conc, fill = Group)) +
ggplot2::geom_col() +
scale_fill_ssd() +
ggplot2::theme(axis.text.x = ggplot2::element_text(angle = 90, vjust = 0.5, hjust = 1))