Architecture Diagrams
This page collects the main visual explanations for the platform. The diagrams show how sign-in works, how the infrastructure is laid out, how requests move through the platform, and how deployment flows are structured. Use this page when you want the visual version of the written documentation.
Select a Diagram
Architecture Overview

Architecture Layers
From Microsoft upstream to BC Gov adaptation to deployed environments

Multi-Tenant Isolation
How ministries share the landing zone securely with data isolation

AI Request Data Flow
Complete request path from user through App Gateway, APIM to AI response

3-Step Access Evolution
Evolution from Container Apps runners (previous) → Bastion native tunnel + jumpbox (current) with cost comparison

Bastion Tunnel Detail
How a SOCKS5 tunnel from the runner/laptop reaches private endpoints via Bastion + jumpbox

When Terraform Needs Key Vault
Data plane vs control plane operations with real examples
Stakeholder Infographics (Share These!)

Tenant Resource Group Model
One-pager: Per-ministry RG structure, IP allocation, AVM modules, what's included

What's Included / Not
Included, conditional, and out-of-scope services with IP budget guide

IP Budget Breakdown
Detailed IP allocation: base infrastructure, per-tenant consumption (~6 IPs each), capacity math (~41 tenants per /24 PE subnet)
Network & Infrastructure

Networking Architecture (Detailed)
Complete network diagram: VNets, subnets, NSGs, traffic flow, private endpoints, IP budgets

Network Environments
3 VNets (prod, test, dev) with subnet allocations and NSG rules

Network Architecture
VNet topology, subnets, NSGs, and Bastion connectivity
Platform Access & Security

Control vs Data Plane
Why OIDC works for some operations but not others with private endpoints

Access Methods Architecture
Toggleable access methods: GitHub-hosted runners (CI/CD via the Bastion tunnel), optional self-hosted runners, Bastion + jumpbox

Who Deploys What
Platform Team vs Project Teams: Who owns what infrastructure

Deployment Scenarios
Three paths: Project team, Platform admin, Solo dev with costs
Authentication & CI/CD

OIDC Complete Guide
Full authentication flow, token lifecycle, and architecture overview

Token Exchange Flow
Detailed JWT token exchange between GitHub and Azure

Deployment Pipeline
All GHA workflows, manual dispatch through secure tunnel, phased Terraform

APIM Key Rotation
Daily scheduled rotation with alternating slot pattern and zero-downtime

Scaled Stack Deployment
3-phase execution engine with isolated state files and parallel tenants
Microsoft Reference (Upstream)
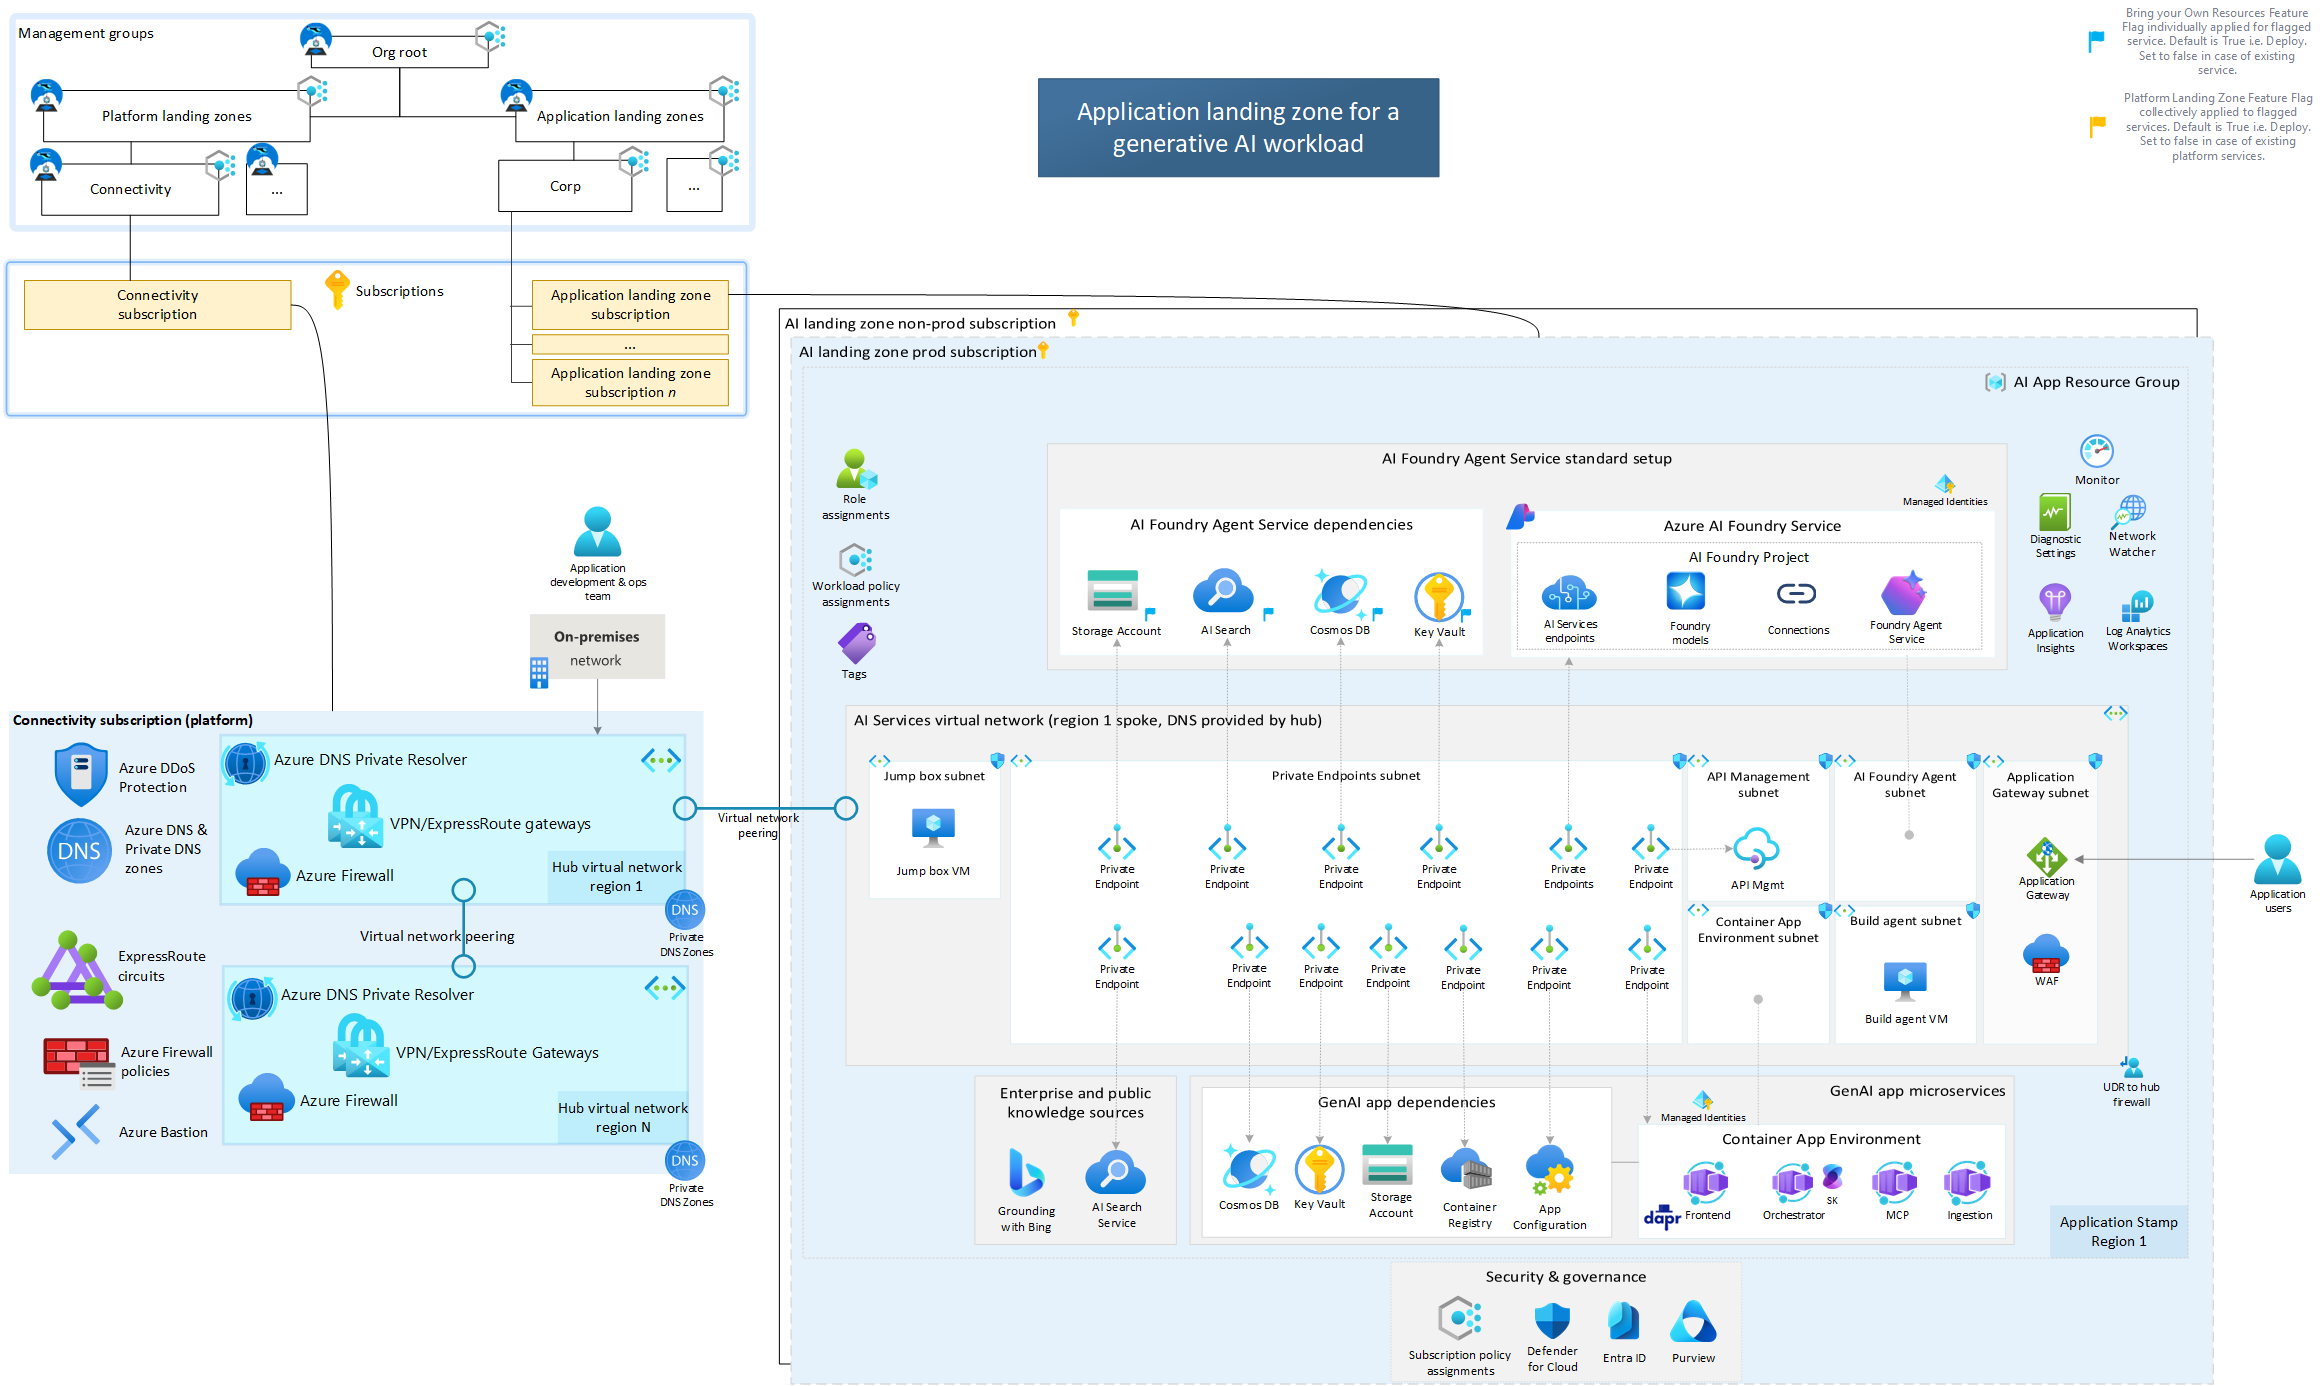
MS: With Platform LZ
Microsoft's reference architecture with Platform Landing Zone (recommended)
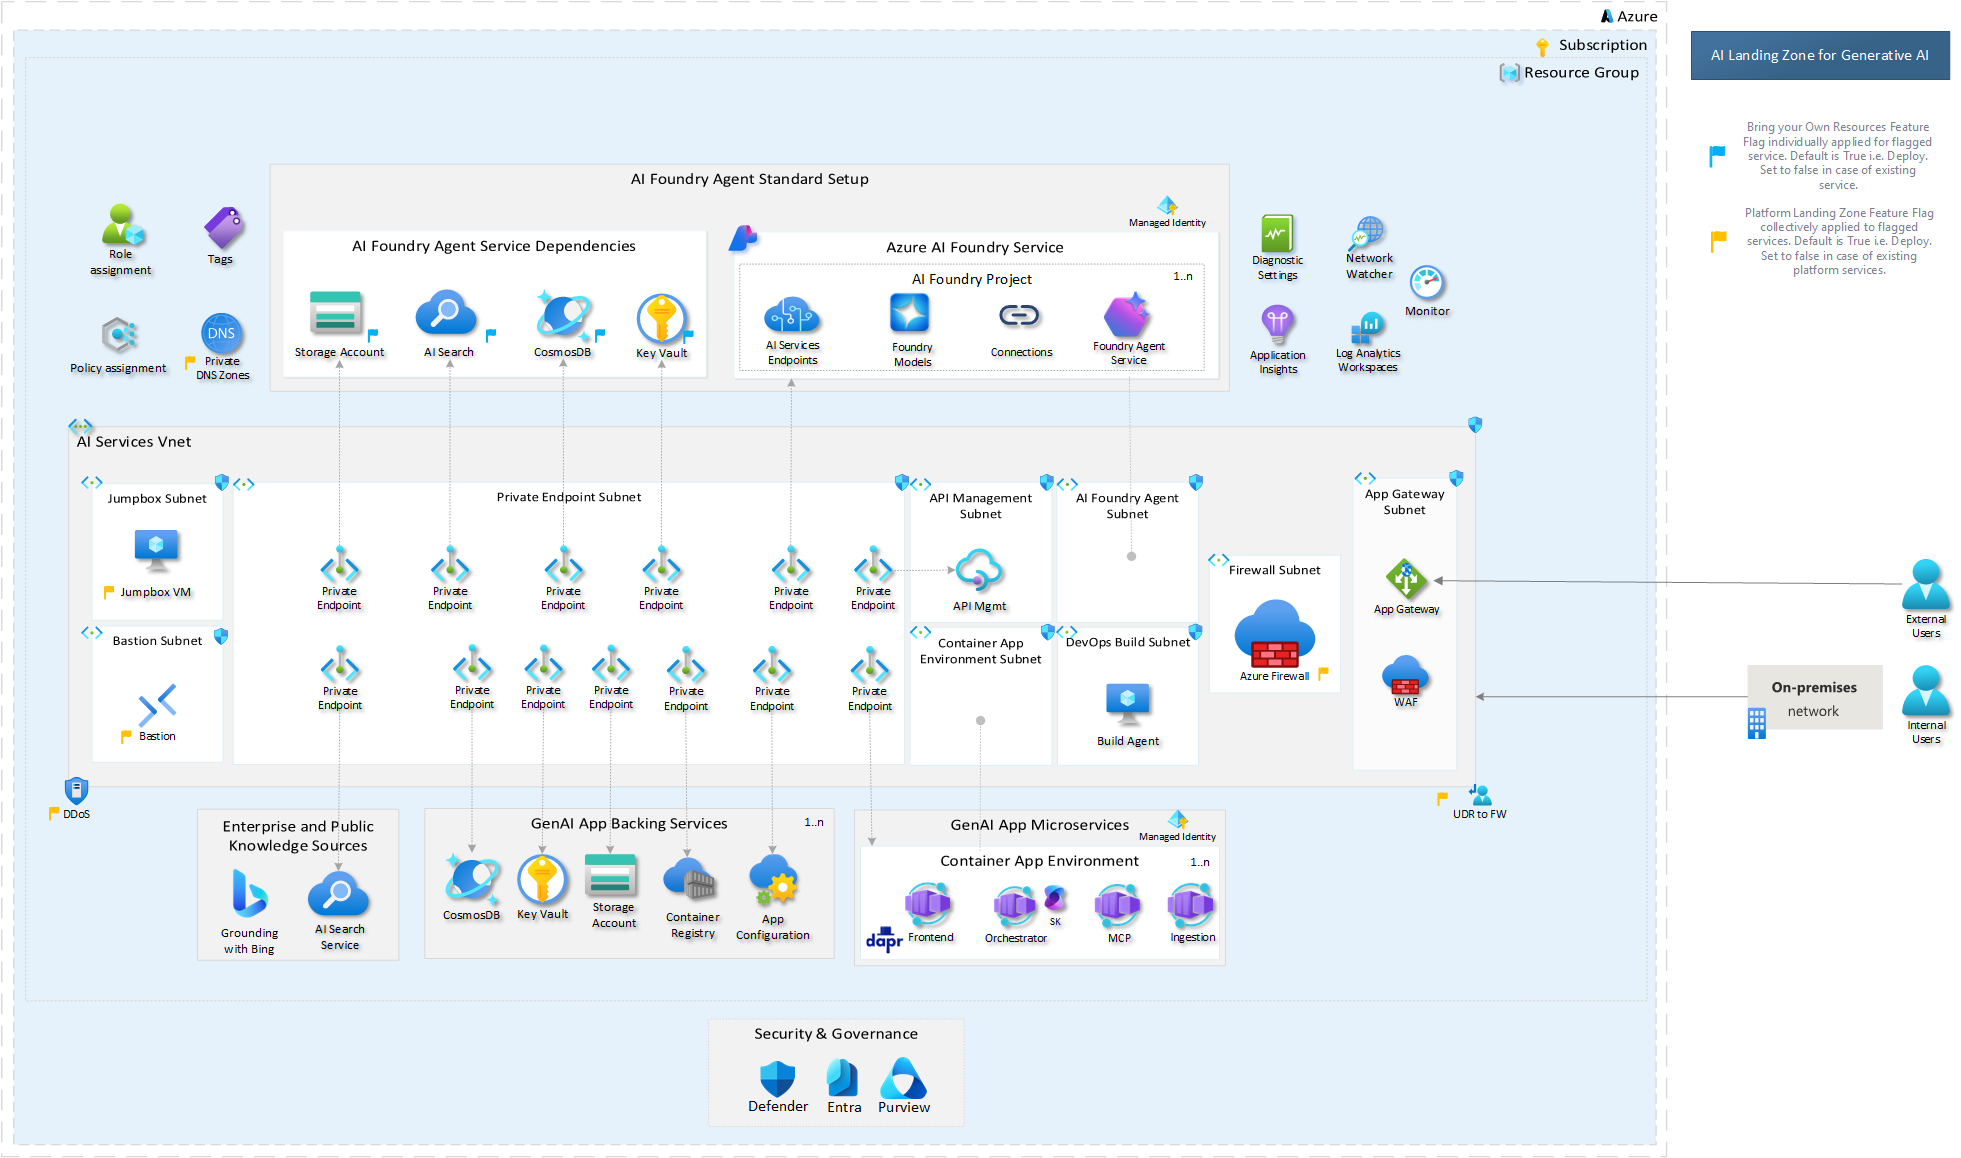
MS: Without Platform LZ
Microsoft's standalone application landing zone reference
Interactive Viewer
Diagram Descriptions
OIDC Complete Guide
The comprehensive diagram showing:
- Section 1: One-time setup process and prerequisites
- Section 2: Token lifecycle and 5-step exchange flow
- Section 3: Terraform backend and workflow configuration
- Section 4: Complete architecture with all components
- Section 5: Quick reference checklist and troubleshooting
Token Exchange Flow
Detailed sequence diagram showing:
- GitHub Actions requesting OIDC token
- JWT claims and audience configuration
- Azure AD token validation
- Federated credential matching
- Access token issuance and scope
Network Architecture
Infrastructure topology showing:
- Virtual Network and address spaces
- Subnet segmentation strategy
- NSG rules and traffic flow
- Bastion and Jumpbox connectivity
- Private endpoint configurations
Network Environments
Complete environment layout:
- 3 VNets (da4cf6-prod/test/dev) — tools VNet is a separate peered spoke (CI/CD only, not in this allocation)
- Subnet allocations per environment
- Canada Central (prod) vs Canada East (non-prod)
- Client connectivity via App Gateway + APIM
- NSG rules and cross-environment isolation
Deployment Pipeline
Complete CI/CD workflow visualization:
- All 6 GHA workflows (manual-dispatch, key-rotation, module mgmt, schedule, PR, pages)
- Manual dispatch to dev/test/prod with OIDC federation
- Bastion deploy → ensure up → SOCKS tunnel (bastion+privoxy)
- Reusable workflow templates (.deployer + .deployer-using-secure-tunnel)
- Script architecture: deploy-terraform.sh → deploy-scaled.sh → 3 phases
APIM Key Rotation
Automated key rotation architecture:
- Daily schedule (9 UTC) + manual dispatch triggers
- Scheduled flow: dev+test parallel → prod gated on test success
- 8-step rotation script process with alternating primary/secondary slots
- Zero-downtime pattern: regenerate inactive → store in KV → swap active
- Infrastructure: APIM ↔ Hub Key Vault ↔ Terraform Config
Scaled Stack Deployment
3-phase execution engine architecture:
- 5 isolated Terraform state files (shared, tenant, foundry, apim, tenant-user-mgmt)
- Phase 1: shared foundation (sequential) — network, KV, AppGW, WAF
- Phase 2: tenant stacks (parallel per-tenant) — isolated state
- Phase 3: foundry + apim + tenant-user-mgmt (all 3 in parallel)
- Performance: ~4m39s total (19% improvement over monolithic)
Using SVG Diagrams
SVG diagrams are vector-based, meaning they scale infinitely without losing quality. You can zoom in to see fine details, search text within the diagram, and even modify colors or extract sections for presentations.
Tips for Working with SVG Diagrams
In Browser
- Use Ctrl+F to search for text
- Right-click → "Open image in new tab" for native zoom
- Browser zoom (Ctrl +/-) works on SVG
Downloaded
- Open in VS Code for editing
- Use Inkscape for advanced modifications
- Import into Figma/Sketch for presentations