Plot monthly means and add long-term mean annual discharge percentages. Calculates statistics
from all values, unless specified. Mean data calculated using calc_longterm_daily_stats() function.
Returns a list of plots.
plot_monthly_means(
  data,
  dates = Date,
  values = Value,
  groups = STATION_NUMBER,
  station_number,
  roll_days = 1,
  roll_align = "right",
  water_year_start = 1,
  start_year,
  end_year,
  exclude_years,
  months = 1:12,
  plot_months = 1:12,
  complete_years = FALSE,
  ignore_missing = FALSE,
  include_title = FALSE,
  percent_MAD = c(10, 20, 100)
)
Arguments
- data
Data frame of daily data that contains columns of dates, flow values, and (optional) groups (e.g. station numbers). Leave blank or set to
NULLif usingstation_numberargument.- dates
Name of column in
datathat contains dates formatted YYYY-MM-DD. Only required if dates column name is not 'Date' (default). Leave blank or set toNULLif usingstation_numberargument.- values
Name of column in
datathat contains numeric flow values, in units of cubic metres per second. Only required if values column name is not 'Value' (default). Leave blank if usingstation_numberargument.- groups
Name of column in
datathat contains unique identifiers for different data sets, if applicable. Only required if groups column name is not 'STATION_NUMBER'. Function will automatically group by a column named 'STATION_NUMBER' if present. Remove the 'STATION_NUMBER' column beforehand to remove this grouping. Leave blank if usingstation_numberargument.- station_number
Character string vector of seven digit Water Survey of Canada station numbers (e.g.
"08NM116") of which to extract daily streamflow data from a HYDAT database. Requirestidyhydatpackage and a HYDAT database. Leave blank if usingdataargument.- roll_days
Numeric value of the number of days to apply a rolling mean. Default
1.- roll_align
Character string identifying the direction of the rolling mean from the specified date, either by the first (
'left'), last ('right'), or middle ('center') day of the rolling n-day group of observations. Default'right'.- water_year_start
Numeric value indicating the month (
1through12) of the start of water year for analysis. Default1.- start_year
Numeric value of the first year to consider for analysis. Leave blank or set well before start date (i.e.
1800) to use from the first year of the source data.- end_year
Numeric value of the last year to consider for analysis. Leave blank or set well after end date (i.e.
2100) to use up to the last year of the source data.- exclude_years
Numeric vector of years to exclude from analysis. Leave blank or set to
NULLto include all years.- months
Numeric vector of months to include in analysis. For example,
3for March,6:8for Jun-Aug orc(10:12,1)for first four months (Oct-Jan) whenwater_year_start = 10(Oct). Default summarizes all months (1:12).- plot_months
Numeric vector of months to include on the plot after calculating statistics. For example,
3for March or6:8for Jun-Aug. Differs from 'months' argument where that argument filters for specific months, this one just chooses which months to plot. Default1:12.- complete_years
Logical values indicating whether to include only years with complete data in analysis. Default
FALSE.- ignore_missing
Logical value indicating whether dates with missing values should be included in the calculation. If
TRUEthen a statistic will be calculated regardless of missing dates. IfFALSEthen only those statistics from time periods with no missing dates will be returned. DefaultFALSE.- include_title
Logical value to indicate adding the group/station number to the plot, if provided. Default
FALSE.- percent_MAD
Numeric vector of percentages of long-term mean annual discharge to add to the plot (ex.
20for 20 percent MAD orc(5,10,20)for multiple percentages). Set toNAfor none. Defaultc(10,20,100).
Value
A list of ggplot2 objects for with the following plots for each station provided:
- Annual_Means
a plot that contains annual means with the long-term mean as the x-axis intercept
Examples
# Run if HYDAT database has been downloaded (using tidyhydat::download_hydat())
if (file.exists(tidyhydat::hy_downloaded_db())) {
# Plot monthly means
plot_monthly_means(station_number = "08NM116",
complete_years = TRUE)
# Plot mean flows with custom LTMADs
plot_monthly_means(station_number = "08NM116",
complete_years = TRUE,
percent_MAD = c(5,10,20,100))
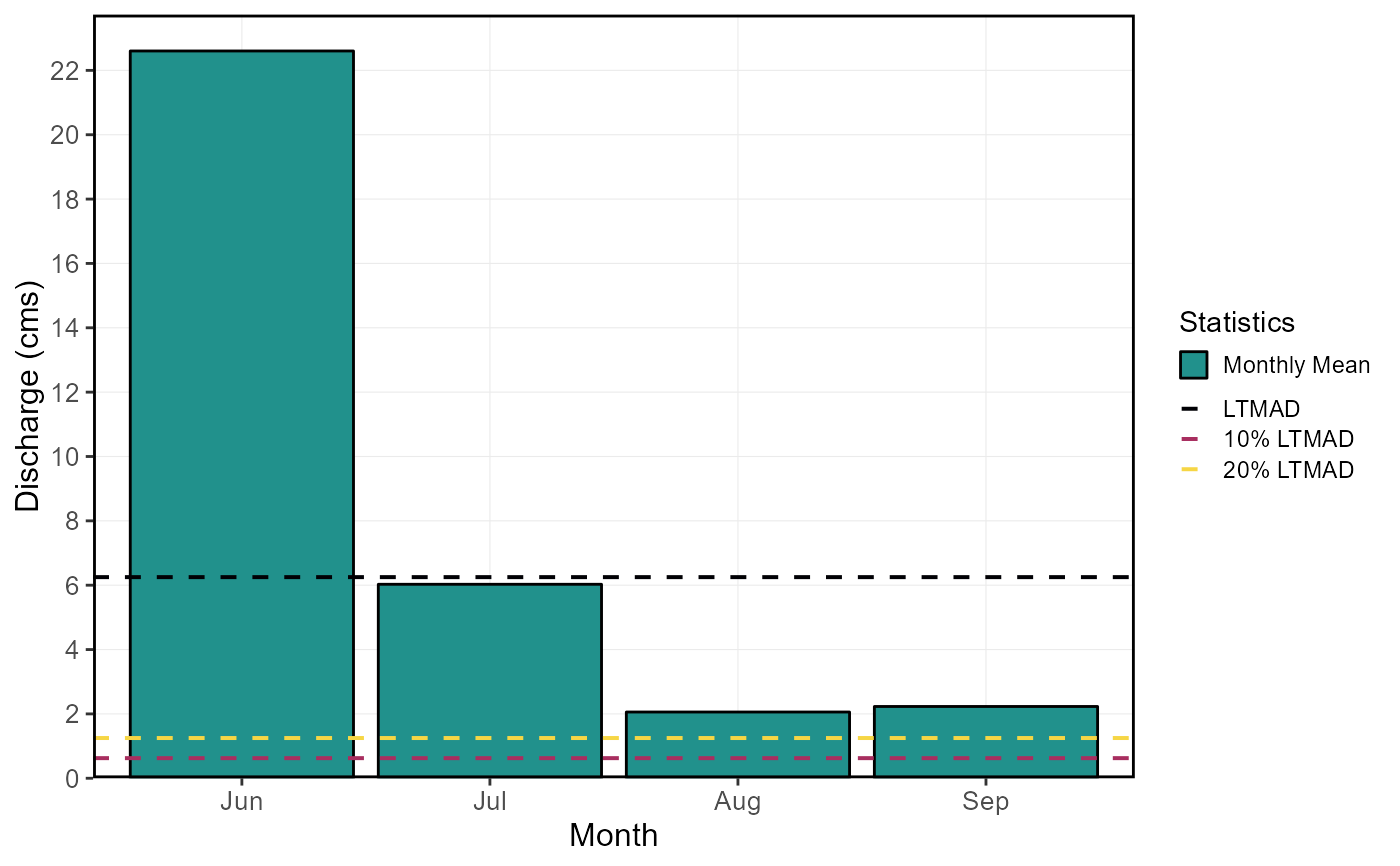
# Plot mean flows and plot just summer months
plot_monthly_means(station_number = "08NM116",
complete_years = TRUE,
plot_months = 6:9)
}
#> $Monthly_Means
#> Warning: Removed 8 rows containing missing values (`position_stack()`).
 #>
#>