Plot daily streamflow data with their symbols
Source:R/plot_flow_data_symbols.R
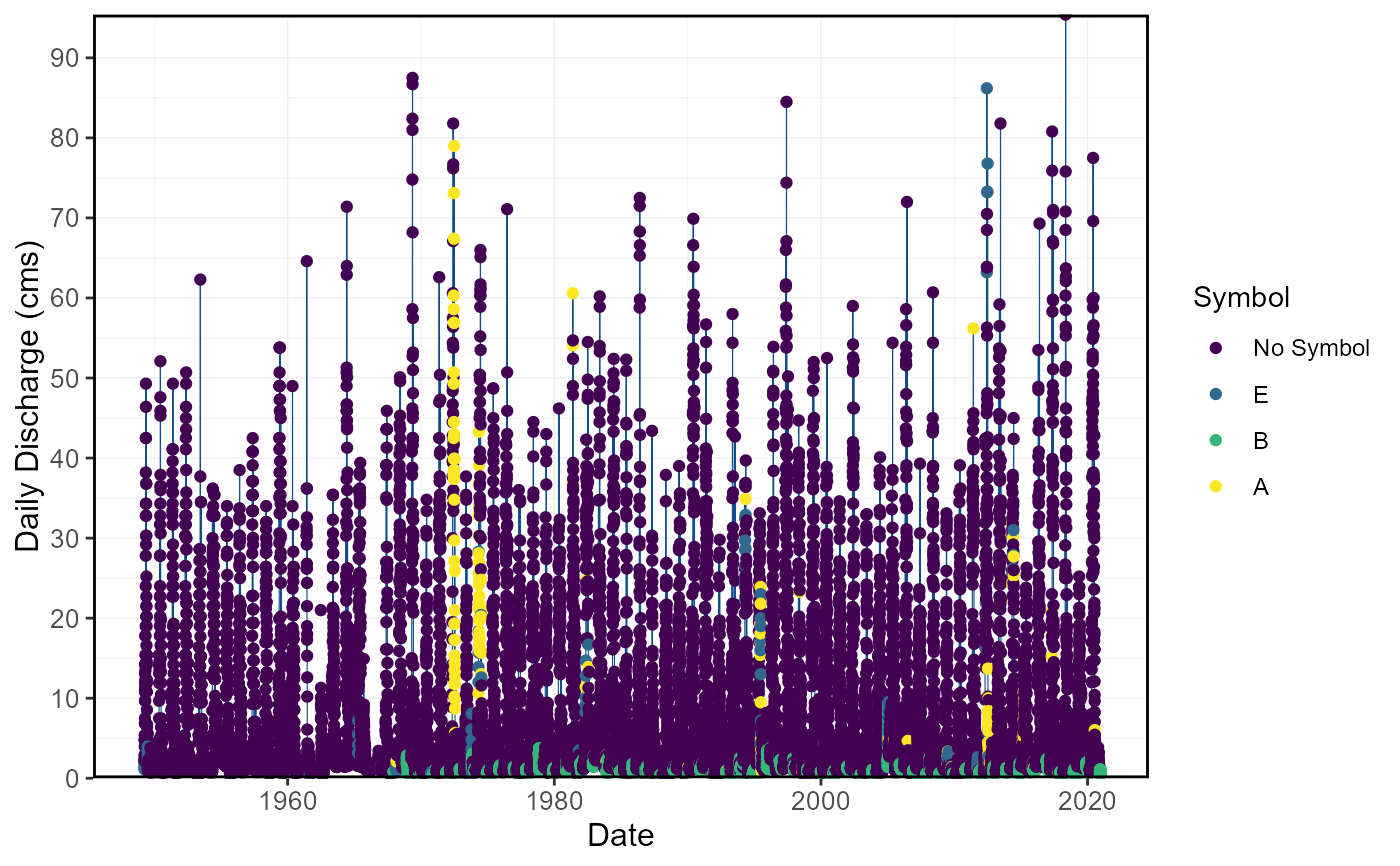
plot_flow_data_symbols.RdPlots data symbols for a daily data set. A column of symbols is required, default symbols = 'Symbol'.
For HYDAT data, symbols include: 'E' Estimate, 'A' Partial Day, 'B' Ice Conditions, 'D' Dry, and 'R' Revised.
Other symbols or categories may be used to colour points of plot.
Returns a list of plots.
plot_flow_data_symbols(
  data,
  dates = Date,
  values = Value,
  groups = STATION_NUMBER,
  symbols = Symbol,
  station_number,
  water_year_start = 1,
  start_year,
  end_year,
  exclude_years,
  months = 1:12,
  start_date,
  end_date,
  log_discharge = FALSE,
  include_title = FALSE
)
Arguments
- data
Data frame of daily data that contains columns of dates, flow values, and (optional) groups (e.g. station numbers). Leave blank or set to
NULLif usingstation_numberargument.- dates
Name of column in
datathat contains dates formatted YYYY-MM-DD. Only required if dates column name is not 'Date' (default). Leave blank or set toNULLif usingstation_numberargument.- values
Name of column in
datathat contains numeric flow values, in units of cubic metres per second. Only required if values column name is not 'Value' (default). Leave blank if usingstation_numberargument.- groups
Name of column in
datathat contains unique identifiers for different data sets, if applicable. Only required if groups column name is not 'STATION_NUMBER'. Function will automatically group by a column named 'STATION_NUMBER' if present. Remove the 'STATION_NUMBER' column beforehand to remove this grouping. Leave blank if usingstation_numberargument.- symbols
Name of column in
datathat contains symbols. Only required if symbols column name is not 'Symbol' (default). Leave blank or set toNULLif usingstation_numberargument.- station_number
Character string vector of seven digit Water Survey of Canada station numbers (e.g.
"08NM116") of which to extract daily streamflow data from a HYDAT database. Requirestidyhydatpackage and a HYDAT database. Leave blank if usingdataargument.- water_year_start
Numeric value indicating the month (
1through12) of the start of water year for analysis. Default1.- start_year
Numeric value of the first year to consider for analysis. Leave blank or set well before start date (i.e.
1800) to use from the first year of the source data.- end_year
Numeric value of the last year to consider for analysis. Leave blank or set well after end date (i.e.
2100) to use up to the last year of the source data.- exclude_years
Numeric vector of years to exclude from analysis. Leave blank or set to
NULLto include all years.- months
Numeric vector of months to include in plotting For example,
3for March,6:8for Jun-Aug orc(10:12,1)for first four months (Oct-Jan) whenwater_year_start = 10(Oct). Default plots all months (1:12).- start_date
Date (YYYY-MM-DD) of first date to consider for plotting. Leave blank if all years are required.
- end_date
Date (YYYY-MM-DD) of last date to consider for plotting. Leave blank if all years are required.
- log_discharge
Logical value to indicate plotting the discharge axis (Y-axis) on a logarithmic scale. Default
TRUE.- include_title
Logical value to indicate adding the group/station number to the plot, if provided. Default
FALSE.
Value
A list of ggplot2 objects with the following for each station provided:
- Flow_Data_Symbols
a plot that contains the flow data with symbol categories
Examples
# Run if HYDAT database has been downloaded (using tidyhydat::download_hydat())
if (file.exists(tidyhydat::hy_downloaded_db())) {

# Plot data and symbols from a data frame and data argument
flow_data <- tidyhydat::hy_daily_flows(station_number = "08NM116")
plot_flow_data_symbols(data = flow_data)

# Plot data and symbols using station_number argument with defaults
plot_flow_data_symbols(station_number = "08NM116")

}
#> Note: Did not plot 3394 missing or excluded values between 1949-01-01 and 2020-12-31.
#> Note: Did not plot 3394 missing or excluded values between 1949-01-01 and 2020-12-31.
#> $Flow_Data_Symbols

#>
#>