Plot annual summary statistics for data screening
Source:R/plot_data_screening.R
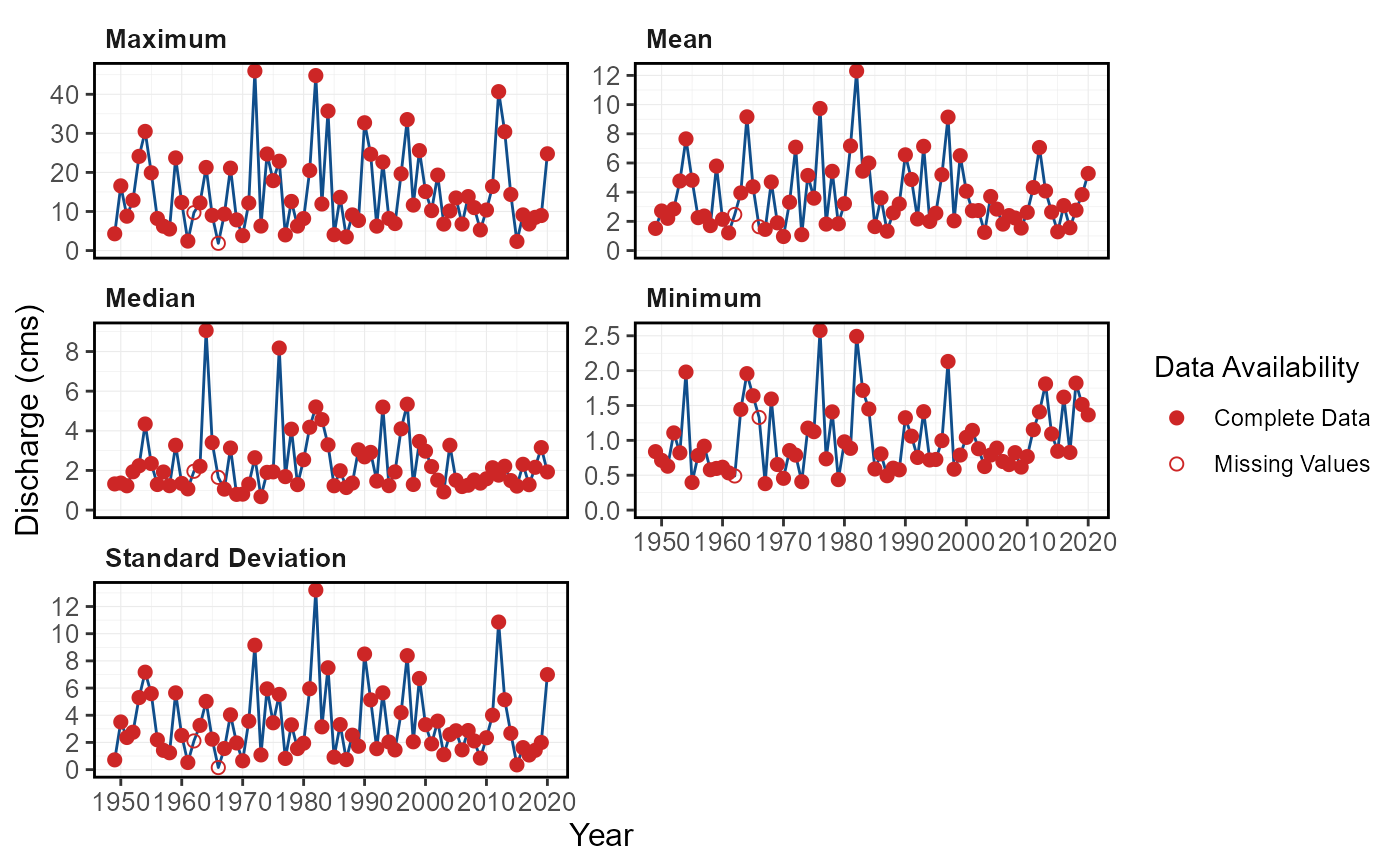
plot_data_screening.RdPlots the mean, median, maximum, minimum, standard deviation of annual flows and indicates data availability.
Calculates statistics from all values, unless specified. Data calculated using screen_flow_data() function.
Returns a list of plots.
plot_data_screening(
  data,
  dates = Date,
  values = Value,
  groups = STATION_NUMBER,
  station_number,
  roll_days = 1,
  roll_align = "right",
  water_year_start = 1,
  months = 1:12,
  start_year,
  end_year,
  include_title = FALSE,
  plot_availability = TRUE,
  include_stats = c("Mean", "Median", "Minimum", "Maximum", "Standard Deviation")
)
Arguments
- data
Data frame of daily data that contains columns of dates, flow values, and (optional) groups (e.g. station numbers). Leave blank or set to
NULLif usingstation_numberargument.- dates
Name of column in
datathat contains dates formatted YYYY-MM-DD. Only required if dates column name is not 'Date' (default). Leave blank or set toNULLif usingstation_numberargument.- values
Name of column in
datathat contains numeric flow values, in units of cubic metres per second. Only required if values column name is not 'Value' (default). Leave blank if usingstation_numberargument.- groups
Name of column in
datathat contains unique identifiers for different data sets, if applicable. Only required if groups column name is not 'STATION_NUMBER'. Function will automatically group by a column named 'STATION_NUMBER' if present. Remove the 'STATION_NUMBER' column beforehand to remove this grouping. Leave blank if usingstation_numberargument.- station_number
Character string vector of seven digit Water Survey of Canada station numbers (e.g.
"08NM116") of which to extract daily streamflow data from a HYDAT database. Requirestidyhydatpackage and a HYDAT database. Leave blank if usingdataargument.- roll_days
Numeric value of the number of days to apply a rolling mean. Default
1.- roll_align
Character string identifying the direction of the rolling mean from the specified date, either by the first (
'left'), last ('right'), or middle ('center') day of the rolling n-day group of observations. Default'right'.- water_year_start
Numeric value indicating the month (
1through12) of the start of water year for analysis. Default1.- months
Numeric vector of months to include in analysis. For example,
3for March,6:8for Jun-Aug orc(10:12,1)for first four months (Oct-Jan) whenwater_year_start = 10(Oct). Default summarizes all months (1:12).- start_year
Numeric value of the first year to consider for analysis. Leave blank or set well before start date (i.e.
1800) to use from the first year of the source data.- end_year
Numeric value of the last year to consider for analysis. Leave blank or set well after end date (i.e.
2100) to use up to the last year of the source data.- include_title
Logical value to indicate adding the group/station number to the plot, if provided. Default
FALSE.- plot_availability
Logical value specifying whether to indicate if years contain complete data or missing values. Default
TRUE. UseFALSEfor original fasstr version.- include_stats
Vector of one or all of
c("Mean", "Median", "Minimum", "Maximum", "Standard Deviation")to list annual summary statistics to plot for screening. Default all.
Value
A list of ggplot2 objects with the following for each station provided:
- Data_Screening
a plot that contains annual summary statistics for screening
Default plots on each object:
- Minimum
annual minimum of all daily flows for a given year
- Maximum
annual maximum of all daily flows for a given year
- Mean
annual mean of all daily flows for a given year
- StandardDeviation
annual 1 standard deviation of all daily flows for a given year
See also
Examples
# Run if HYDAT database has been downloaded (using tidyhydat::download_hydat())
if (file.exists(tidyhydat::hy_downloaded_db())) {

# Plot screening statistics using a data frame and data argument with defaults
flow_data <- tidyhydat::hy_daily_flows(station_number = "08NM116")
plot_data_screening(data = flow_data)

# Plot screening statistics using station_number argument with defaults
plot_data_screening(station_number = "08NM116")

# Plot screening statistics for water years starting in October
plot_data_screening(station_number = "08NM116",
                 water_year_start = 10)

# Plot screening statistics for 7-day flows for July-September months only
plot_data_screening(station_number = "08NM116",
                 roll_days = 7,
                 months = 7:9)

}
#> $Data_Screening

#>
#>