Plot cumulative daily flow statistics
Source:R/plot_daily_cumulative_stats.R
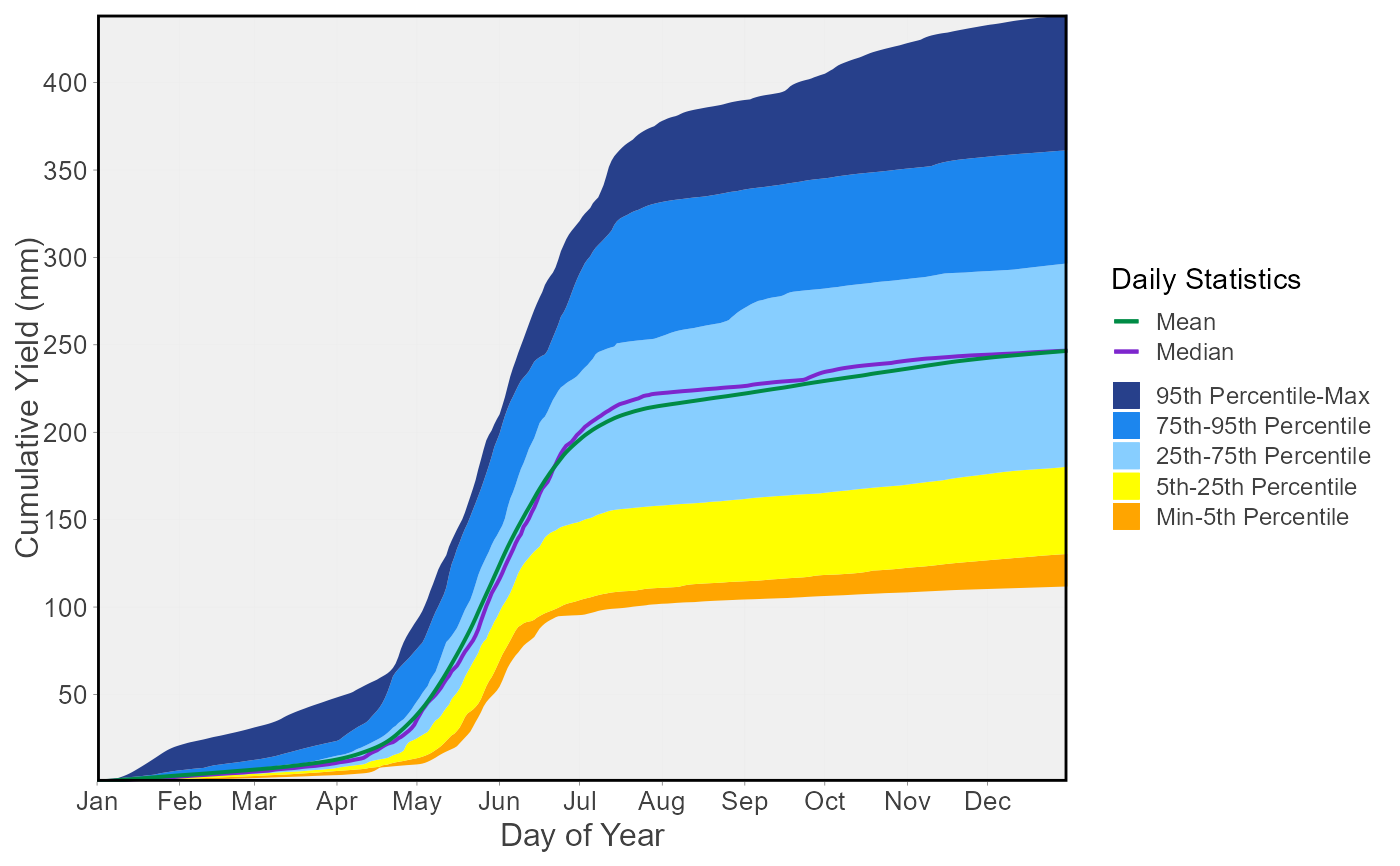
plot_daily_cumulative_stats.RdPlot the daily cumulative mean, median, maximum, minimum, and 5, 25, 75, 95th percentiles for each day of the year
from a daily streamflow data set. Calculates statistics from all values from complete, unless specified.
Data calculated using calc_daily_cumulative_stats() function. Can plot individual years for comparison using the
add_year argument. Defaults to volumetric cumulative flows, can use use_yield and basin_area to convert to
water yield. Returns a list of plots.
plot_daily_cumulative_stats(
  data,
  dates = Date,
  values = Value,
  groups = STATION_NUMBER,
  station_number,
  use_yield = FALSE,
  basin_area,
  water_year_start = 1,
  start_year,
  end_year,
  exclude_years,
  months = 1:12,
  log_discharge = FALSE,
  log_ticks = ifelse(log_discharge, TRUE, FALSE),
  include_title = FALSE,
  add_year
)
Arguments
- data
Data frame of daily data that contains columns of dates, flow values, and (optional) groups (e.g. station numbers). Leave blank or set to
NULLif usingstation_numberargument.- dates
Name of column in
datathat contains dates formatted YYYY-MM-DD. Only required if dates column name is not 'Date' (default). Leave blank or set toNULLif usingstation_numberargument.- values
Name of column in
datathat contains numeric flow values, in units of cubic metres per second. Only required if values column name is not 'Value' (default). Leave blank if usingstation_numberargument.- groups
Name of column in
datathat contains unique identifiers for different data sets, if applicable. Only required if groups column name is not 'STATION_NUMBER'. Function will automatically group by a column named 'STATION_NUMBER' if present. Remove the 'STATION_NUMBER' column beforehand to remove this grouping. Leave blank if usingstation_numberargument.- station_number
Character string vector of seven digit Water Survey of Canada station numbers (e.g.
"08NM116") of which to extract daily streamflow data from a HYDAT database. Requirestidyhydatpackage and a HYDAT database. Leave blank if usingdataargument.- use_yield
Logical value indicating whether to calculate area-based water yield, in mm, instead of volumetric discharge. Default
FALSE.- basin_area
Upstream drainage basin area, in square kilometres, to apply to observations. Three options:
(1) Leave blank if
groupsis STATION_NUMBER with HYDAT station numbers to extract basin areas from HYDAT.(2) A single numeric value to apply to all observations.
(3) List each basin area for each group/station in groups (can override HYDAT value if listed) as such
c("08NM116" = 795,
"08NM242" = 10)
. If group is not listed the HYDAT area will be applied if it exists, otherwise it will beNA.- water_year_start
Numeric value indicating the month (
1through12) of the start of water year for analysis. Default1.- start_year
Numeric value of the first year to consider for analysis. Leave blank or set well before start date (i.e.
1800) to use from the first year of the source data.- end_year
Numeric value of the last year to consider for analysis. Leave blank or set well after end date (i.e.
2100) to use up to the last year of the source data.- exclude_years
Numeric vector of years to exclude from analysis. Leave blank or set to
NULLto include all years.- months
Numeric vector of months to include in analysis. For example,
3for March,6:8for Jun-Aug orc(10:12,1)for first four months (Oct-Jan) whenwater_year_start = 10(Oct). Default summarizes all months (1:12). Need to be consecutive months for given year/water year to work properly.- log_discharge
Logical value to indicate plotting the discharge axis (Y-axis) on a logarithmic scale. Default
FALSE.- log_ticks
Logical value to indicate plotting logarithmic scale ticks when
log_discharge = TRUE. Ticks will not appear whenlog_discharge = FALSE. Default toTRUEwhenlog_discharge = TRUE.- include_title
Logical value to indicate adding the group/station number to the plot, if provided. Default
FALSE.- add_year
Numeric value indicating a year of daily flows to add to the daily statistics plot. Leave blank or set to
NULLfor no years.
Value
A list of ggplot2 objects with the following for each station provided:
- Daily_Cumulative_Stats
a plot that contains daily cumulative flow statistics
Default plots on each object:
- Mean
daily cumulative mean
- Median
daily cumulative median
- Min-5 Percentile Range
a ribbon showing the range of data between the daily cumulative minimum and 5th percentile
- 5-25 Percentiles Range
a ribbon showing the range of data between the daily cumulative 5th and 25th percentiles
- 25-75 Percentiles Range
a ribbon showing the range of data between the daily cumulative 25th and 75th percentiles
- 75-95 Percentiles Range
a ribbon showing the range of data between the daily cumulative 75th and 95th percentiles
- 95 Percentile-Max Range
a ribbon showing the range of data between the daily cumulative 95th percentile and the maximum
- 'Year' Flows
(optional) the daily cumulative flows for the designated year
See also
Examples
# Run if HYDAT database has been downloaded (using tidyhydat::download_hydat())
if (file.exists(tidyhydat::hy_downloaded_db())) {

# Plot annual daily yield statistics with default HYDAT basin area
plot_daily_cumulative_stats(station_number = "08NM116",
                            use_yield = TRUE)

# Plot annual daily yield statistics with custom basin area
plot_daily_cumulative_stats(station_number = "08NM116",
                            use_yield = TRUE,
                            basin_area = 800)

}
#> Warning: One or more years contained partial data and were excluded. Only years with complete data were used for calculations.
#> Warning: One or more years contained partial data and were excluded. Only years with complete data were used for calculations.
#> $Daily_Cumulative_Yield_Stats

#>
#>