Plot annual days above and below normal
Source:R/plot_annual_outside_normal.R
plot_annual_outside_normal.RdThis function has been superseded by the plot_annual_normal_days() function.
Plots the number of days per year outside of the 'normal' range (typically between 25 and 75th percentiles) for
each day of the year. Upper and lower-range percentiles are calculated for each day of the year of from all years, and then each
daily flow value for each year is compared. All days above or below the normal range are included. Calculates statistics from all
values from complete years, unless specified. Data calculated using calc_annual_outside_normal()
function. Returns a list of plots.
plot_annual_outside_normal(
  data,
  dates = Date,
  values = Value,
  groups = STATION_NUMBER,
  station_number,
  normal_percentiles = c(25, 75),
  roll_days = 1,
  roll_align = "right",
  water_year_start = 1,
  start_year,
  end_year,
  exclude_years,
  months = 1:12,
  include_title = FALSE
)
Arguments
- data
Data frame of daily data that contains columns of dates, flow values, and (optional) groups (e.g. station numbers). Leave blank or set to
NULLif usingstation_numberargument.- dates
Name of column in
datathat contains dates formatted YYYY-MM-DD. Only required if dates column name is not 'Date' (default). Leave blank or set toNULLif usingstation_numberargument.- values
Name of column in
datathat contains numeric flow values, in units of cubic metres per second. Only required if values column name is not 'Value' (default). Leave blank if usingstation_numberargument.- groups
Name of column in
datathat contains unique identifiers for different data sets, if applicable. Only required if groups column name is not 'STATION_NUMBER'. Function will automatically group by a column named 'STATION_NUMBER' if present. Remove the 'STATION_NUMBER' column beforehand to remove this grouping. Leave blank if usingstation_numberargument.- station_number
Character string vector of seven digit Water Survey of Canada station numbers (e.g.
"08NM116") of which to extract daily streamflow data from a HYDAT database. Requirestidyhydatpackage and a HYDAT database. Leave blank if usingdataargument.- normal_percentiles
Numeric vector of two values, lower and upper percentiles, respectively indicating the limits of the normal range. Default
c(25,75).- roll_days
Numeric value of the number of days to apply a rolling mean. Default
1.- roll_align
Character string identifying the direction of the rolling mean from the specified date, either by the first (
'left'), last ('right'), or middle ('center') day of the rolling n-day group of observations. Default'right'.- water_year_start
Numeric value indicating the month (
1through12) of the start of water year for analysis. Default1.- start_year
Numeric value of the first year to consider for analysis. Leave blank or set well before start date (i.e.
1800) to use from the first year of the source data.- end_year
Numeric value of the last year to consider for analysis. Leave blank or set well after end date (i.e.
2100) to use up to the last year of the source data.- exclude_years
Numeric vector of years to exclude from analysis. Leave blank or set to
NULLto include all years.- months
Numeric vector of months to include in analysis. For example,
3for March,6:8for Jun-Aug orc(10:12,1)for first four months (Oct-Jan) whenwater_year_start = 10(Oct). Default summarizes all months (1:12).- include_title
Logical value to indicate adding the group/station number to the plot, if provided. Default
FALSE.
Value
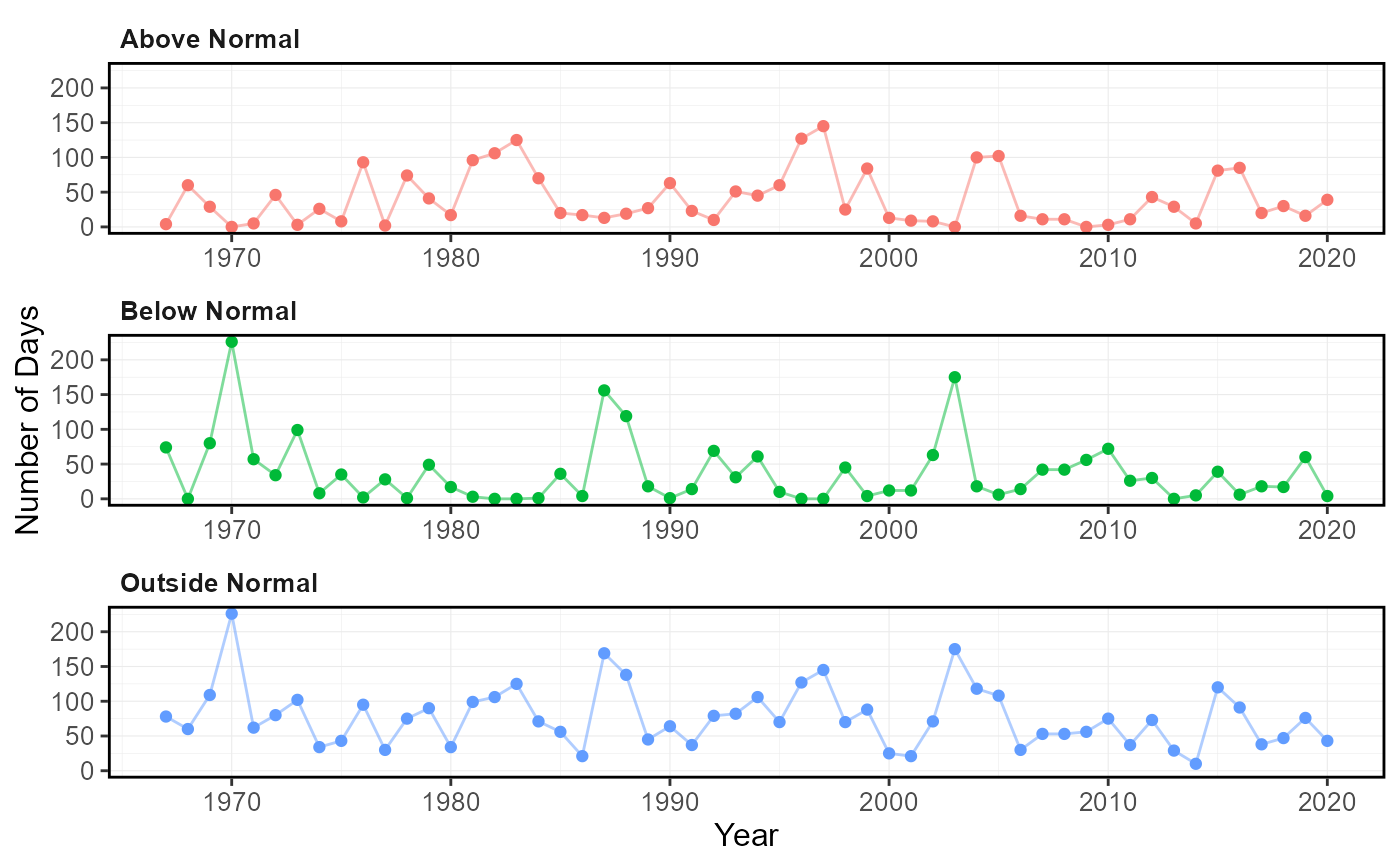
A list of ggplot2 objects with the following for each station provided:
- Annual_Days_Outside_Normal
a plot that contains the number of days outside normal
Default plots on each object:
- Days_Below_Normal
number of days per year below the daily normal (default 25th percentile)
- Days_Above_Normal
number of days per year above the daily normal (default 75th percentile)
- Days_Outside_Normal
number of days per year below and above the daily normal (default 25/75th percentile)
See also
Examples
# Run if HYDAT database has been downloaded (using tidyhydat::download_hydat())
if (file.exists(tidyhydat::hy_downloaded_db())) {

# Plot annual statistics with default limits of normal (25 and 75th percentiles)
plot_annual_outside_normal(station_number = "08NM116")

# Plot annual statistics with custom limits of normal
plot_annual_outside_normal(station_number = "08NM116",
                           normal_percentiles = c(10,90))

}
#> Note: this function has been superseded by the 'plot_annual_normal_days()' function. This function is still supported but no longer receives active development, as better solutions now exist.
#> Note: this function has been superseded by the 'calc_annual_normal_days()' function. This function is still supported but no longer receives active development, as better solutions now exist.
#> Warning: One or more calculations included missing values and NA's were produced. If desired, filter data for complete years or months, or use the 'ignore_missing' or 'allowed_missing' arguments (if applicable) to ignore or allow some missing values.
#> $Annual_Days_Outside_Normal

#>
#>