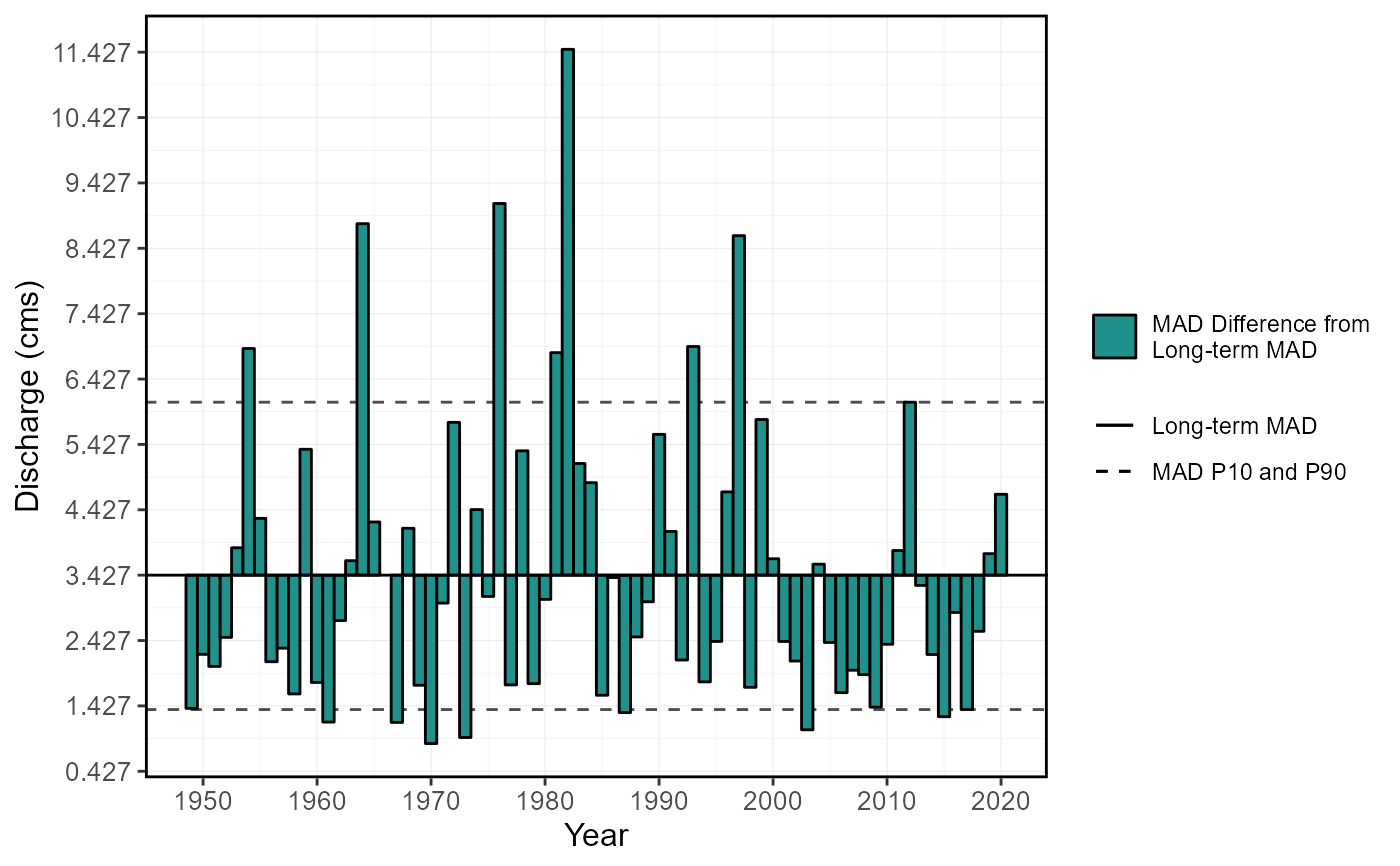
Plot annual means using the long-term annual mean as the point of reference for annual means. Calculates statistics
from all values, unless specified. Data calculated using calc_annual_stats() function. Returns a list of plots.
plot_annual_means(
  data,
  dates = Date,
  values = Value,
  groups = STATION_NUMBER,
  station_number,
  roll_days = 1,
  roll_align = "right",
  water_year_start = 1,
  start_year,
  end_year,
  exclude_years,
  months = 1:12,
  complete_years = FALSE,
  ignore_missing = FALSE,
  allowed_missing = ifelse(ignore_missing, 100, 0),
  include_title = FALSE,
  percentiles_mad = c(10, 90)
)
Arguments
- data
Data frame of daily data that contains columns of dates, flow values, and (optional) groups (e.g. station numbers). Leave blank or set to
NULLif usingstation_numberargument.- dates
Name of column in
datathat contains dates formatted YYYY-MM-DD. Only required if dates column name is not 'Date' (default). Leave blank or set toNULLif usingstation_numberargument.- values
Name of column in
datathat contains numeric flow values, in units of cubic metres per second. Only required if values column name is not 'Value' (default). Leave blank if usingstation_numberargument.- groups
Name of column in
datathat contains unique identifiers for different data sets, if applicable. Only required if groups column name is not 'STATION_NUMBER'. Function will automatically group by a column named 'STATION_NUMBER' if present. Remove the 'STATION_NUMBER' column beforehand to remove this grouping. Leave blank if usingstation_numberargument.- station_number
Character string vector of seven digit Water Survey of Canada station numbers (e.g.
"08NM116") of which to extract daily streamflow data from a HYDAT database. Requirestidyhydatpackage and a HYDAT database. Leave blank if usingdataargument.- roll_days
Numeric value of the number of days to apply a rolling mean. Default
1.- roll_align
Character string identifying the direction of the rolling mean from the specified date, either by the first (
'left'), last ('right'), or middle ('center') day of the rolling n-day group of observations. Default'right'.- water_year_start
Numeric value indicating the month (
1through12) of the start of water year for analysis. Default1.- start_year
Numeric value of the first year to consider for analysis. Leave blank or set well before start date (i.e.
1800) to use from the first year of the source data.- end_year
Numeric value of the last year to consider for analysis. Leave blank or set well after end date (i.e.
2100) to use up to the last year of the source data.- exclude_years
Numeric vector of years to exclude from analysis. Leave blank or set to
NULLto include all years.- months
Numeric vector of months to include in analysis. For example,
3for March,6:8for Jun-Aug orc(10:12,1)for first four months (Oct-Jan) whenwater_year_start = 10(Oct). Default summarizes all months (1:12).- complete_years
Logical values indicating whether to include only years with complete data in analysis. Default
FALSE.- ignore_missing
Logical value indicating whether dates with missing values should be included in the calculation. If
TRUEthen a statistic will be calculated regardless of missing dates. IfFALSEthen only those statistics from time periods with no missing dates will be returned. DefaultFALSE.- allowed_missing
Numeric value between 0 and 100 indicating the percentage of missing dates allowed to be included to calculate a statistic (0 to 100 percent). If
'ignore_missing = FALSE'then it defaults to0(zero missing dates allowed), if'ignore_missing = TRUE'then it defaults to100(any missing dates allowed); consistent withignore_missingusage. Supersedesignore_missingwhen used.- include_title
Logical value to indicate adding the group/station number to the plot, if provided. Default
FALSE.- percentiles_mad
Numeric vector of percentiles of annual means to plot, up to two values. Set to
NAif none required. Defaultc(10,90).
Value
A list of ggplot2 objects for with the following plots for each station provided:
- Annual_Means
a plot that contains annual means with the long-term mean as the x-axis intercept
See also
Examples
# Run if HYDAT database has been downloaded (using tidyhydat::download_hydat())
if (file.exists(tidyhydat::hy_downloaded_db())) {

# Plot annual means
plot_annual_means(station_number = "08NM116")

# Plot mean flows from July-September
plot_annual_means(station_number = "08NM116",
                  months = 7:9)

}
#> Warning: One or more calculations included missing values and NA's were produced. If desired, filter data for complete years or months, or use the 'ignore_missing' or 'allowed_missing' arguments (if applicable) to ignore or allow some missing values.
#> Warning: One or more calculations included missing values and NA's were produced. If desired, filter data for complete years or months, or use the 'ignore_missing' or 'allowed_missing' arguments (if applicable) to ignore or allow some missing values.
#> $Annual_Means

#>
#>