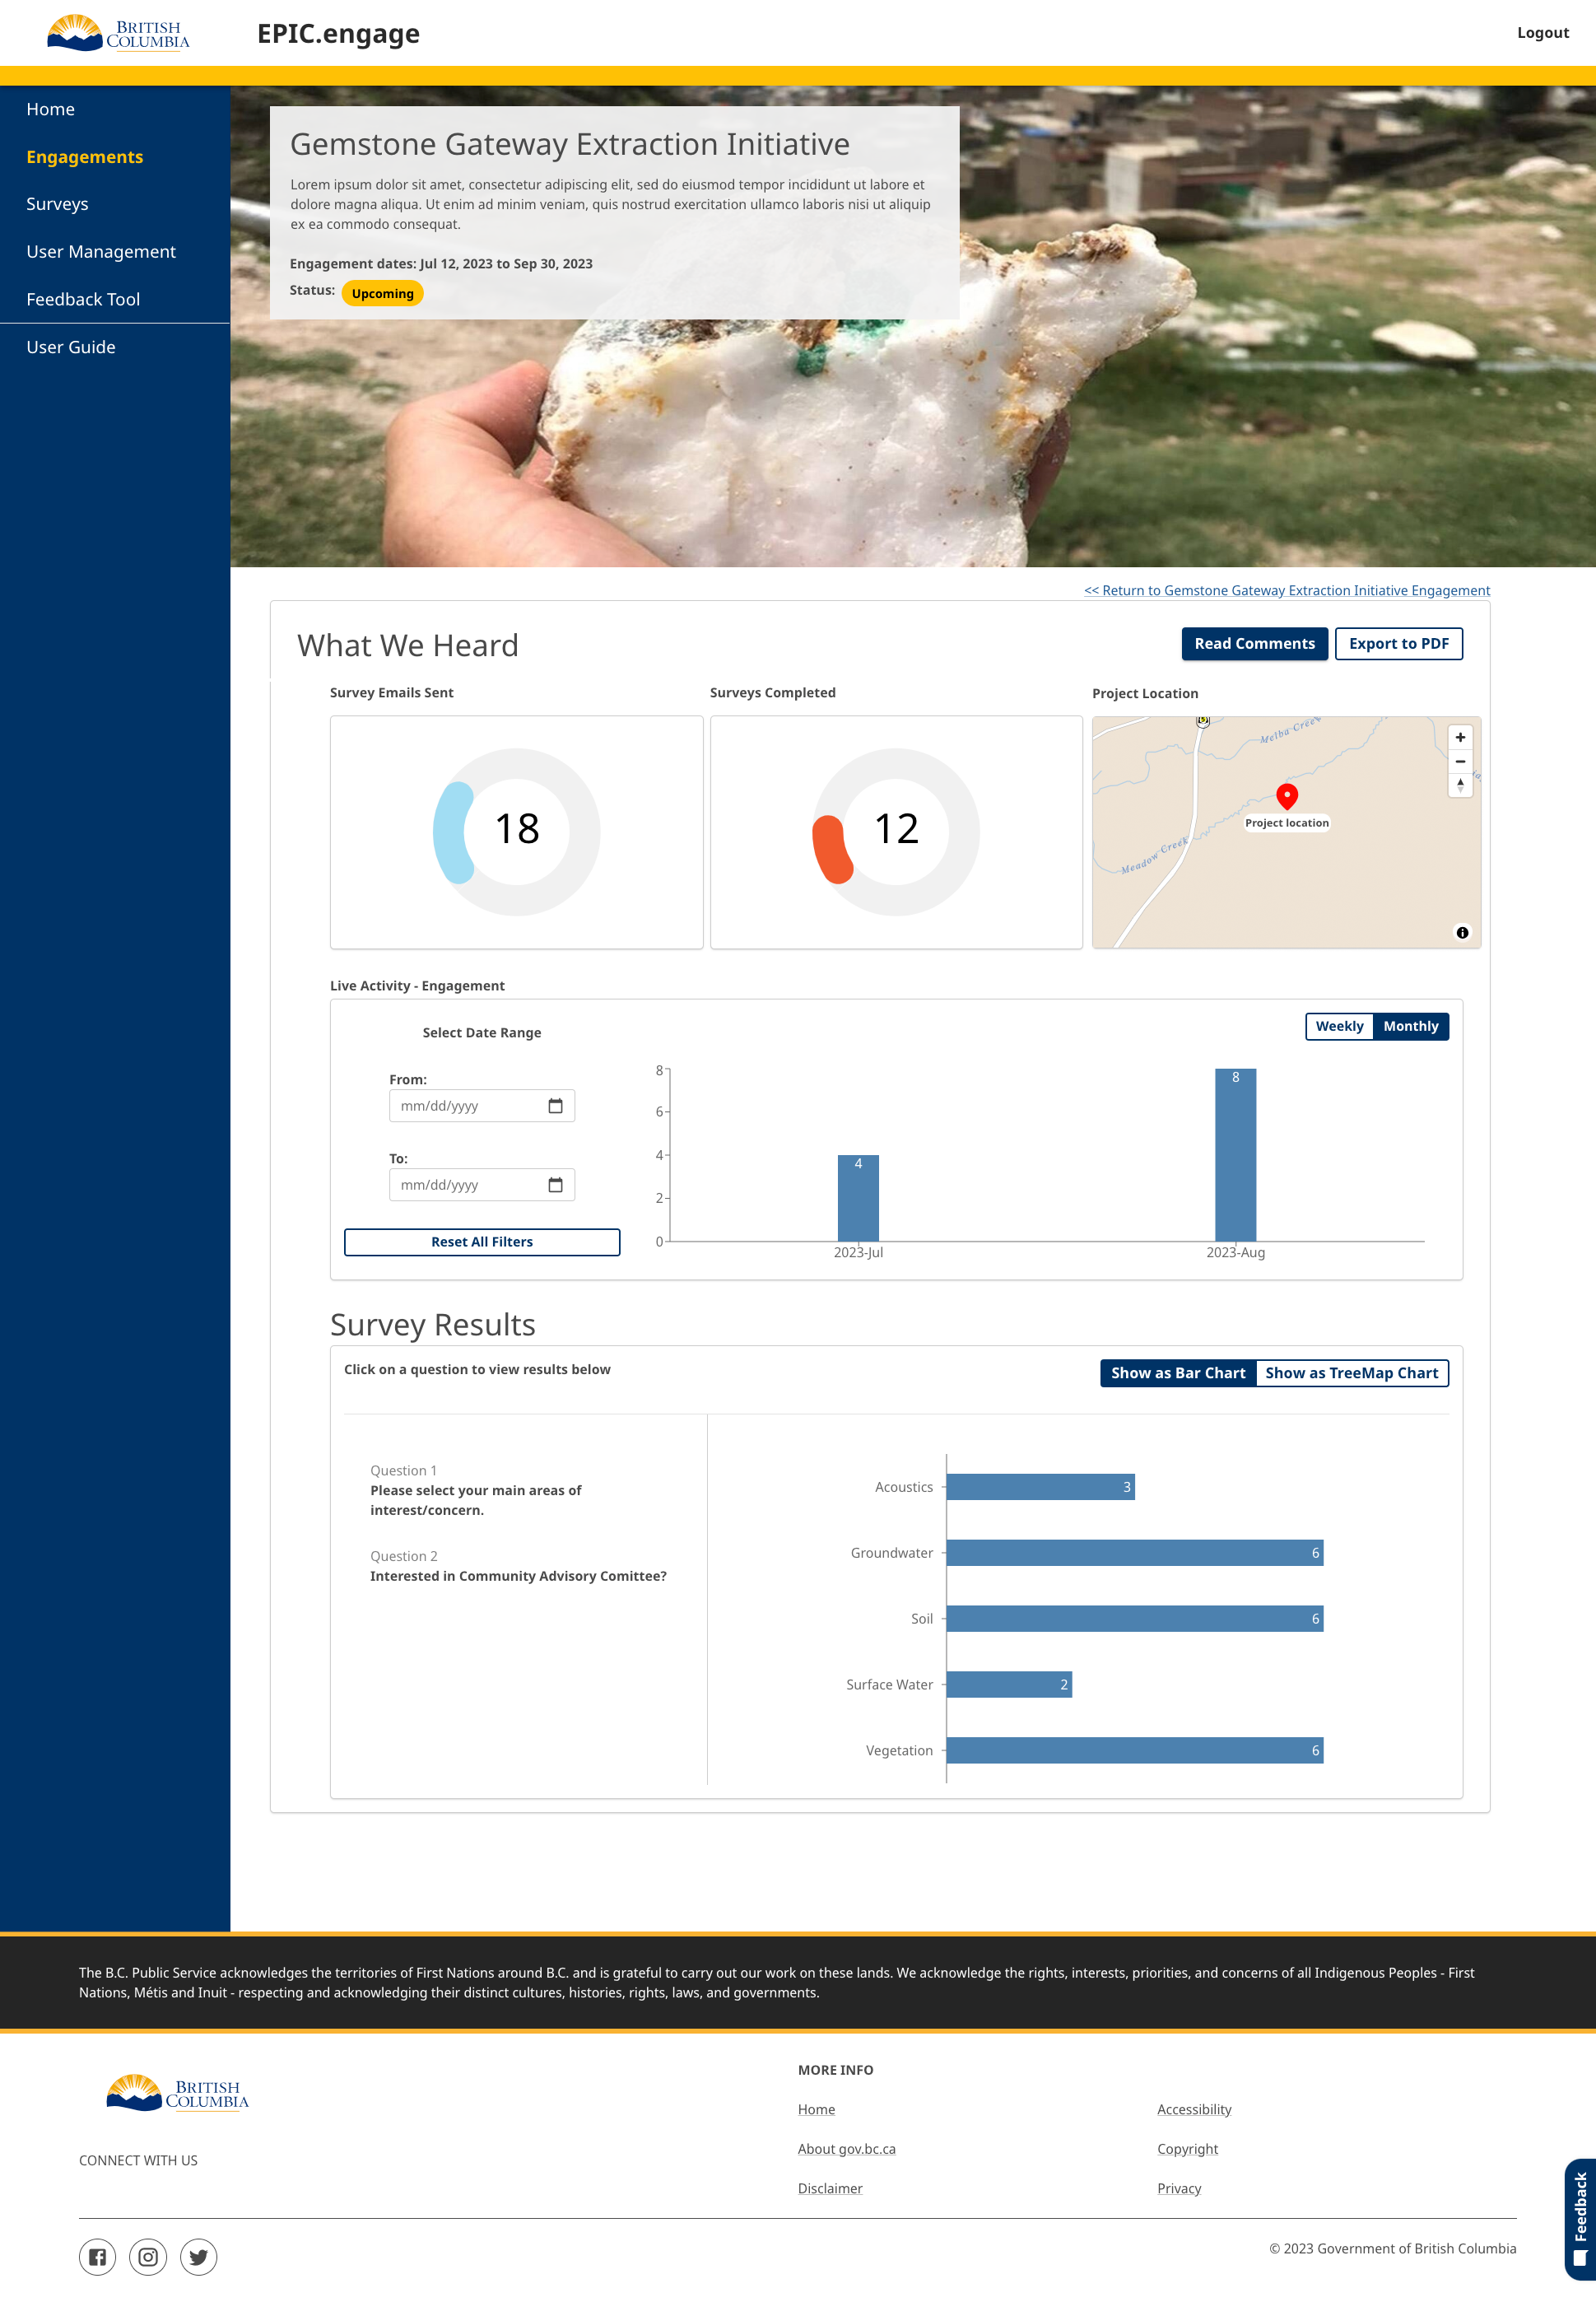
The Report page is where you can view dashboard results, and comments of all open and closed engagements.
From the survey or engagement page, after selecting View Report - Public or View Report - Internal, you will be directed to the dashboard. The Public Report shows you the dashboard and the comments as the public will see it (including only the questions selected to be on the report in the Report Settings). The Internal Report will show you all the questions included in the survey.
Dashboard
The top section of the dashboard will show:
- Survey emails sent
- Surveys completed
- Project location
The Live Activity graphic allows you to view the response rates over weeks or months. You can additionally input a date range to see the volume of response rates during that period.
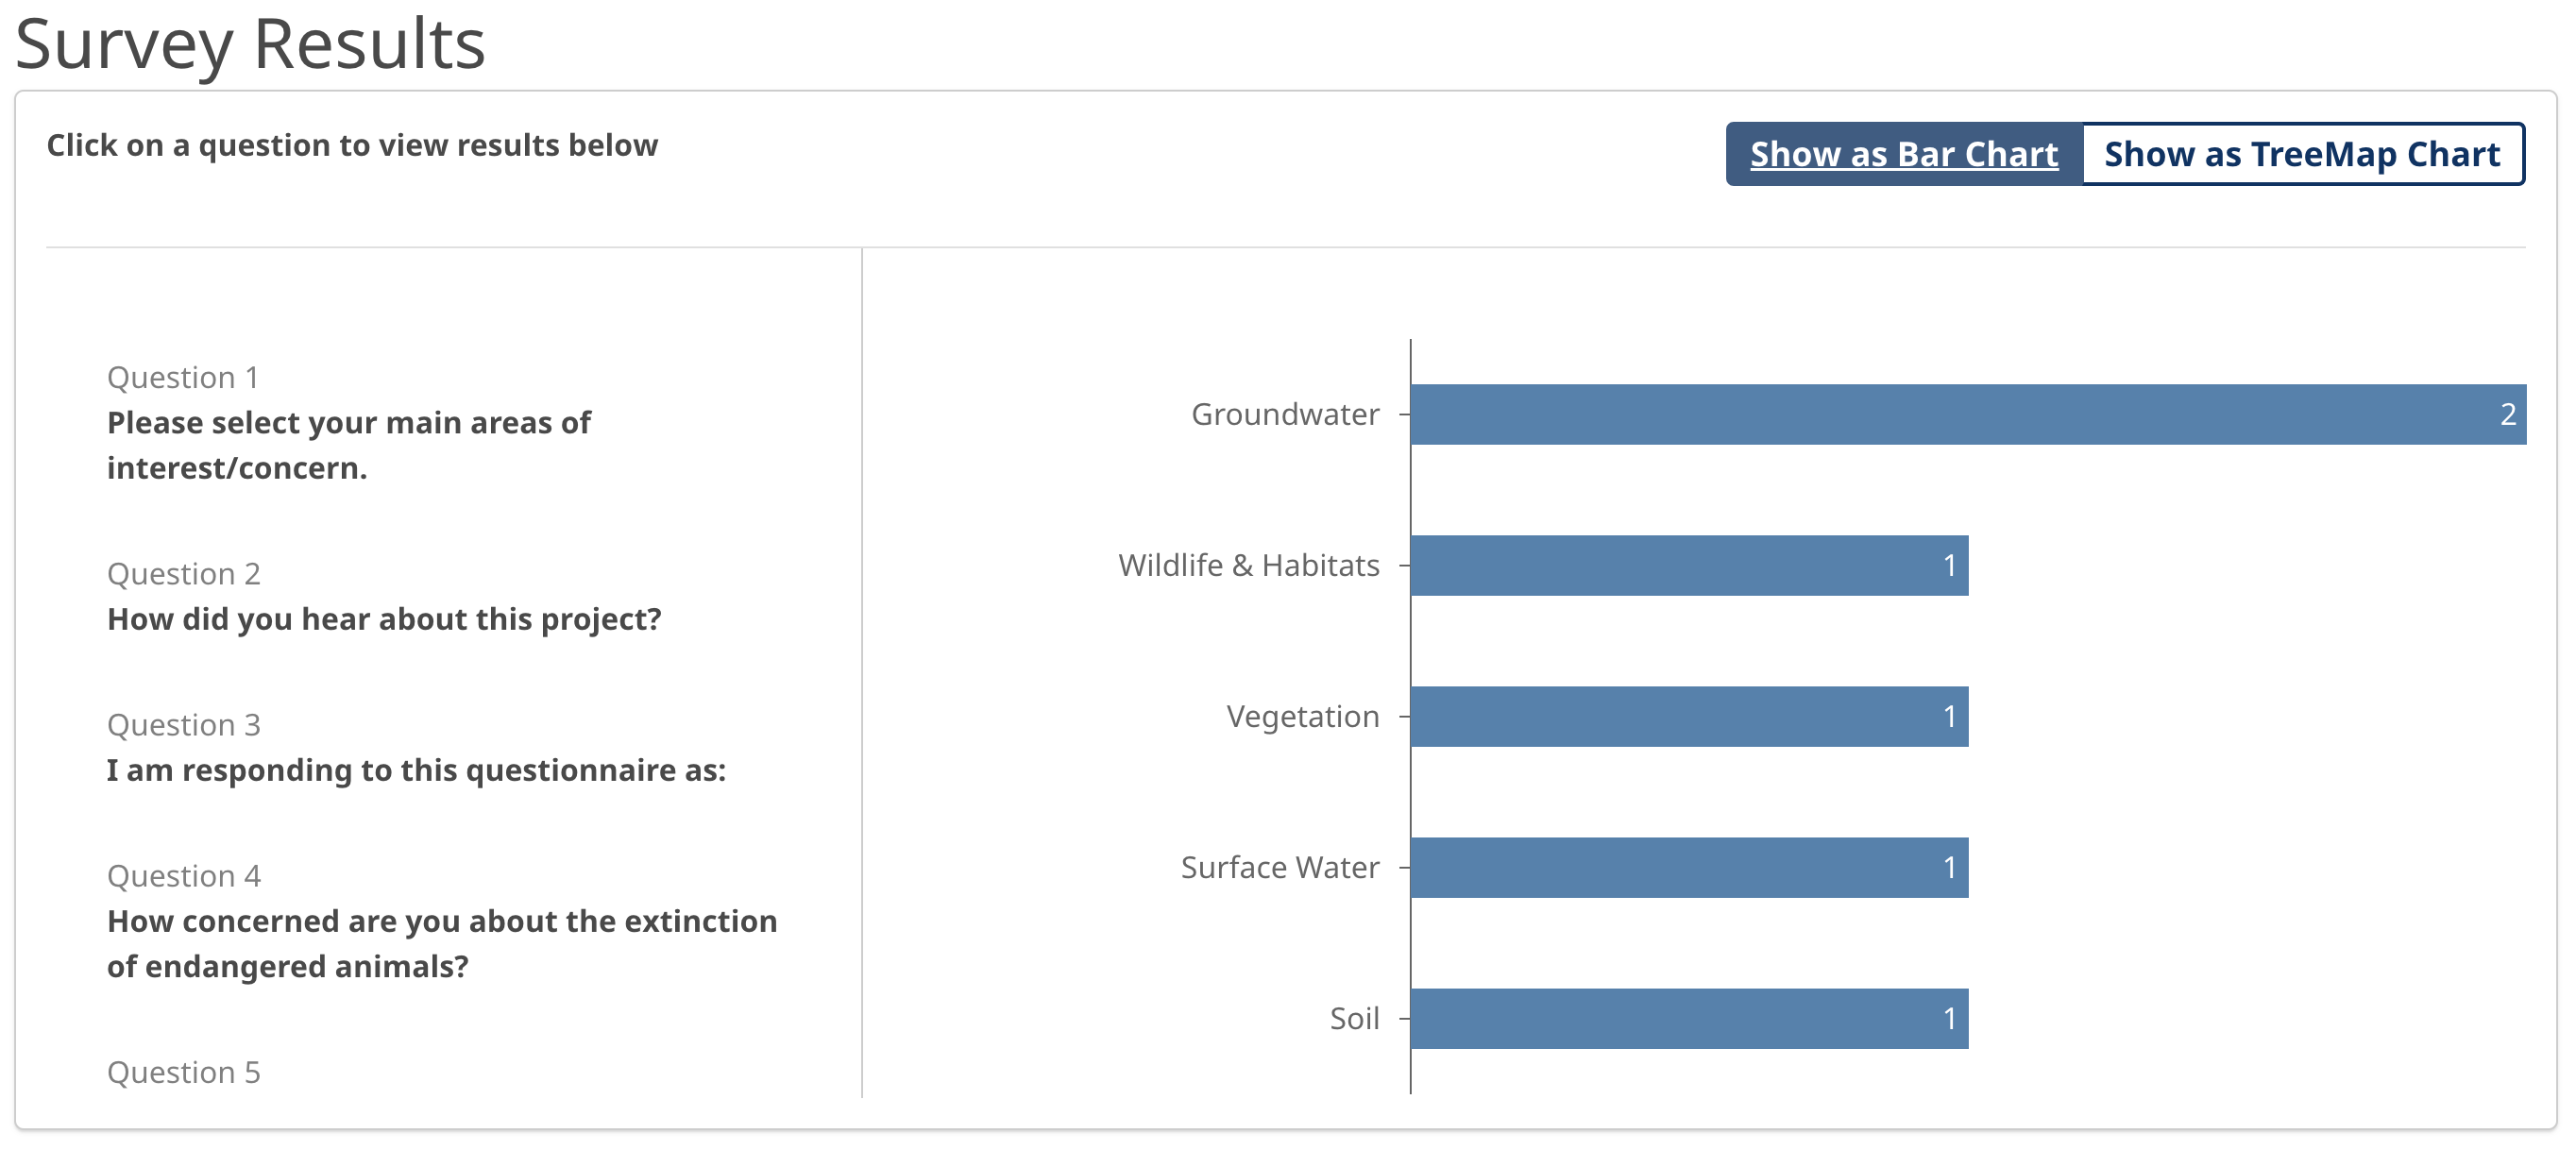
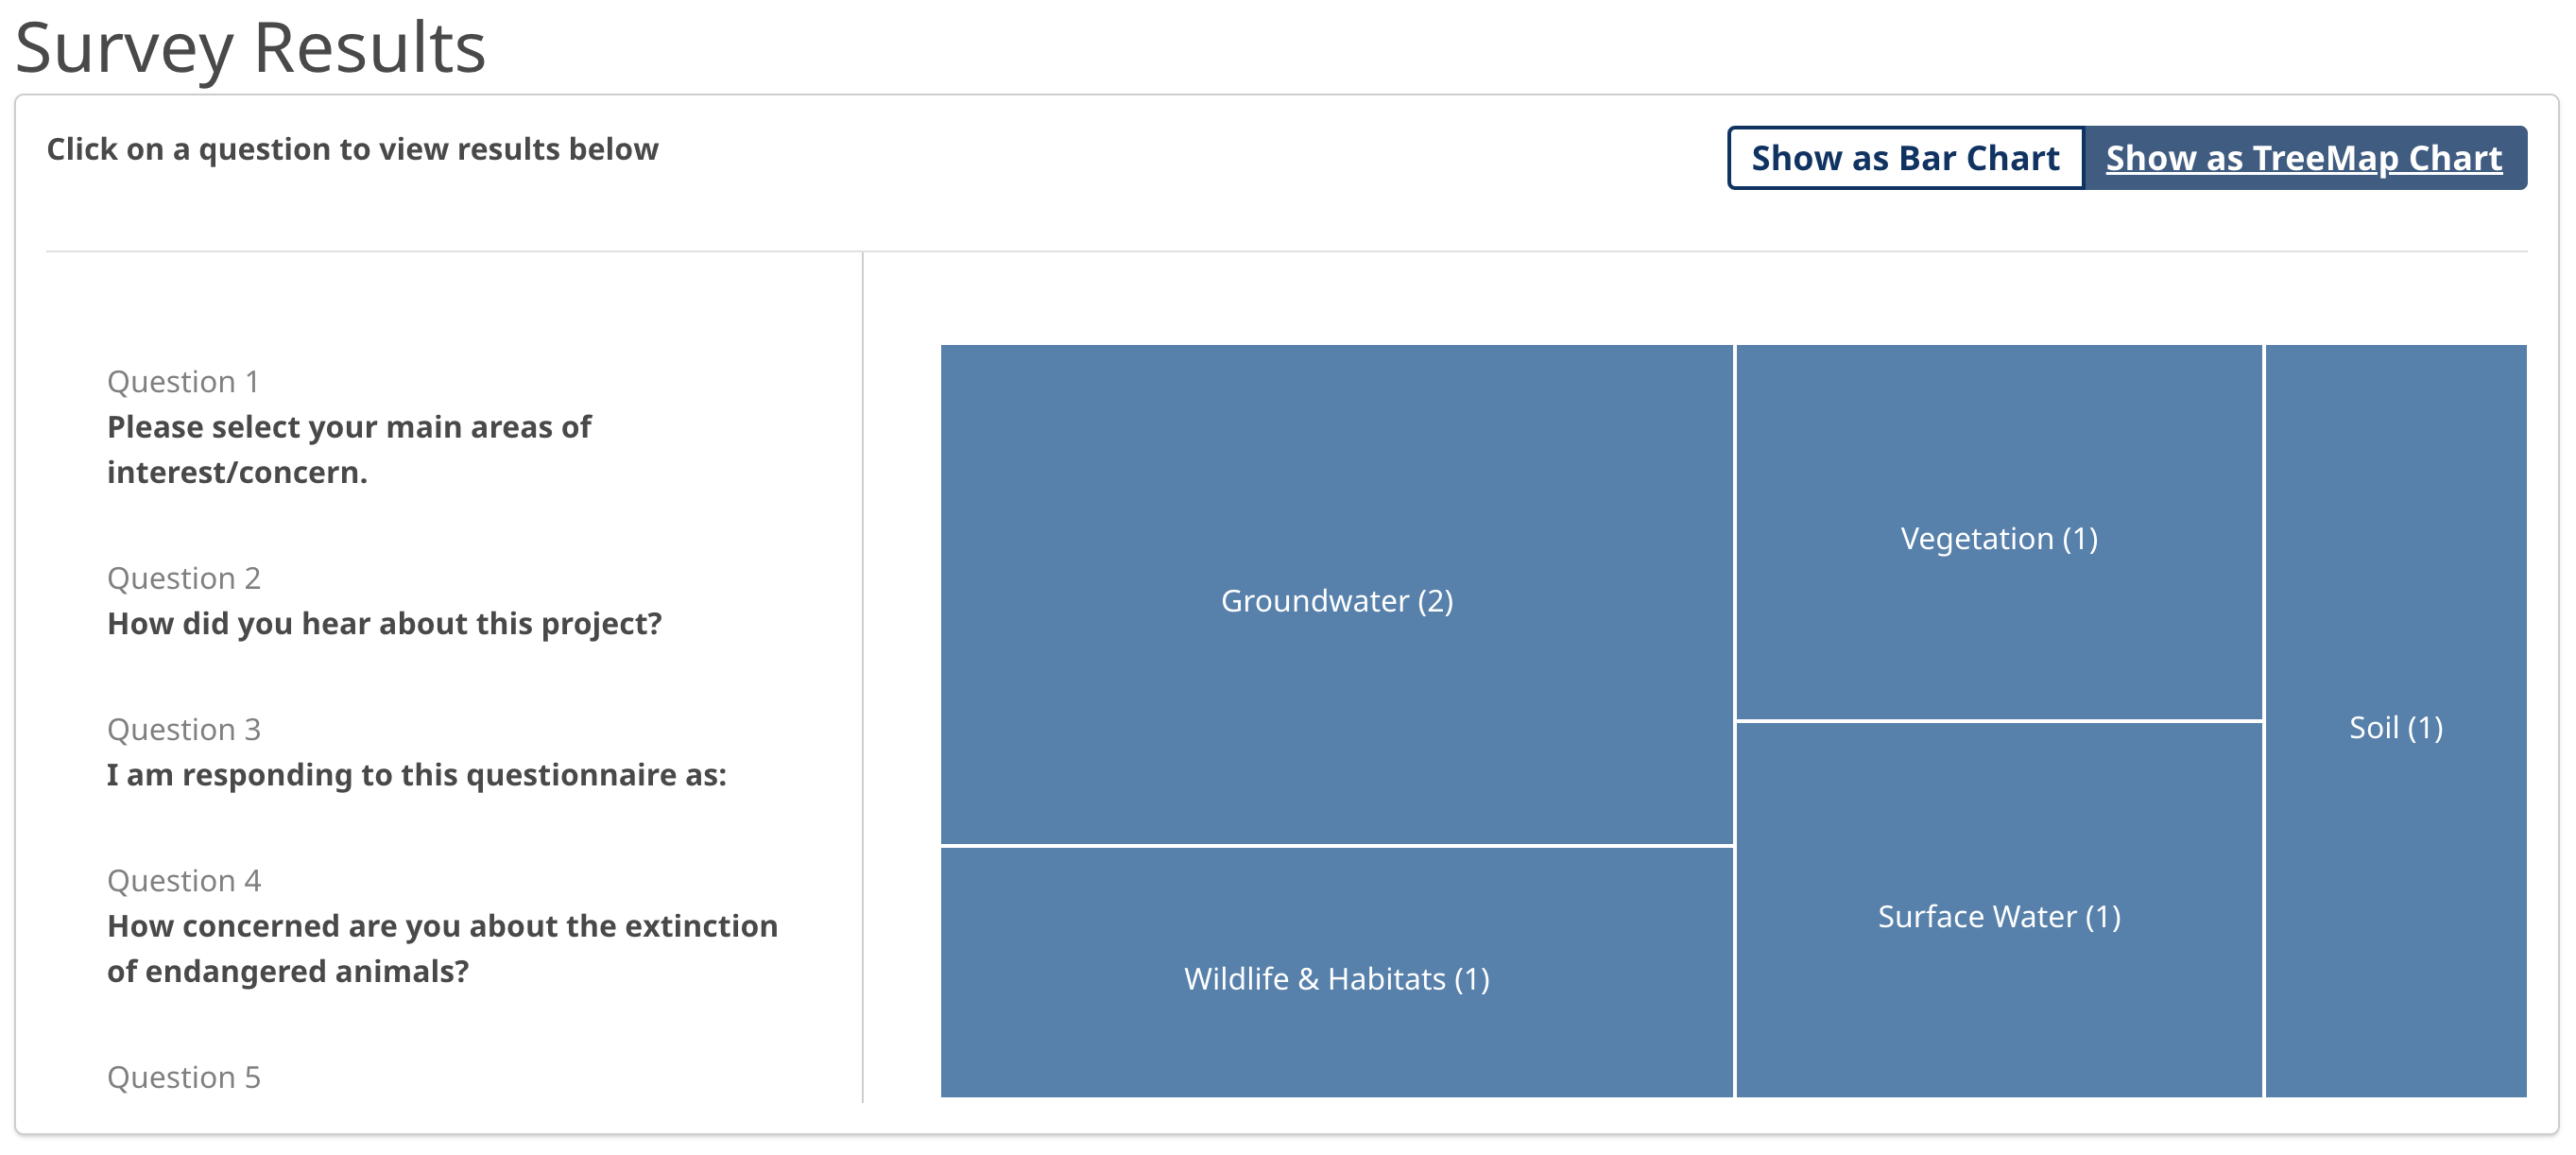
In Survey Results, you can select which question results you want displayed, and toggle the displays between a Barchart and Treemap.
To export the dashboard, you can click the Export to PDF button on the top right corner of the dashboard.
You can access all the approved comments by clicking the Read Comments button on the top right of the dashboard.


