Chapter 7 comparison with combined mulitple layers’ projection
As noted the provincial NSYT process generates yield projections using only the Rank 1 (R1) forest layer from each VRI polygon. This approach was adopted to support efficient province-wide yield generation while maintaining consistency with the leading stand layer that typically represents the majority of forest volume and site productivity within a polygon. However, many VRI polygons contain multiple forest layers, such as a primary overstory layer combined with residual, secondary, or understory layers. In a standard VDYP7 workflow, each eligible layer can be projected independently, and the resulting layer-level yields are subsequently aggregated to produce a polygon-level yield projection. As a result, differences may arise between projections generated using only the R1 layer and projections generated by combining all forested layers within a polygon.
This chapter evaluates the magnitude and significance of those differences by comparing the provincial NSYT “R1-only” projections against yield projections derived from the full multi-layer representation of VRI polygons. The analysis examines two distinct polygon types: (1) polygons containing a primary (P) layer and one or more additional live forest layers, and (2) polygons containing only a primary layer with one dead (D) layer. By comparing projected merchantable volume through time for both approaches, the assessment quantifies the effects of simplifying polygon representation to a single layer and evaluates whether the resulting provincial yield estimates remain representative of the yields that would be obtained using the complete multi-layer inventory structure. The results provide an important validation of the NSYT methodology and help identify circumstances where multi-layer stand dynamics may contribute meaningfully to differences in projected yield.
Table 1. numbers multi-layer polygons across the province (from vdyp_input_layer_and_polygon_2024)
| category | N | pct |
|---|---|---|
| onelayer | 5115447 | 83 |
| multilayer | 239892 | 4 |
| P_and_D | 812801 | 13 |
*“multilayer” means the polygon has P layer and at least one other layer that is not D layer; “P_and_D” means the polygon only has P layer and D layer
7.1 set1. r1 only vs multilayer set1 (containing P layer and at least one other layer that is not D layer)
Number of multi-layer polygons that were included in this comparison: 239198
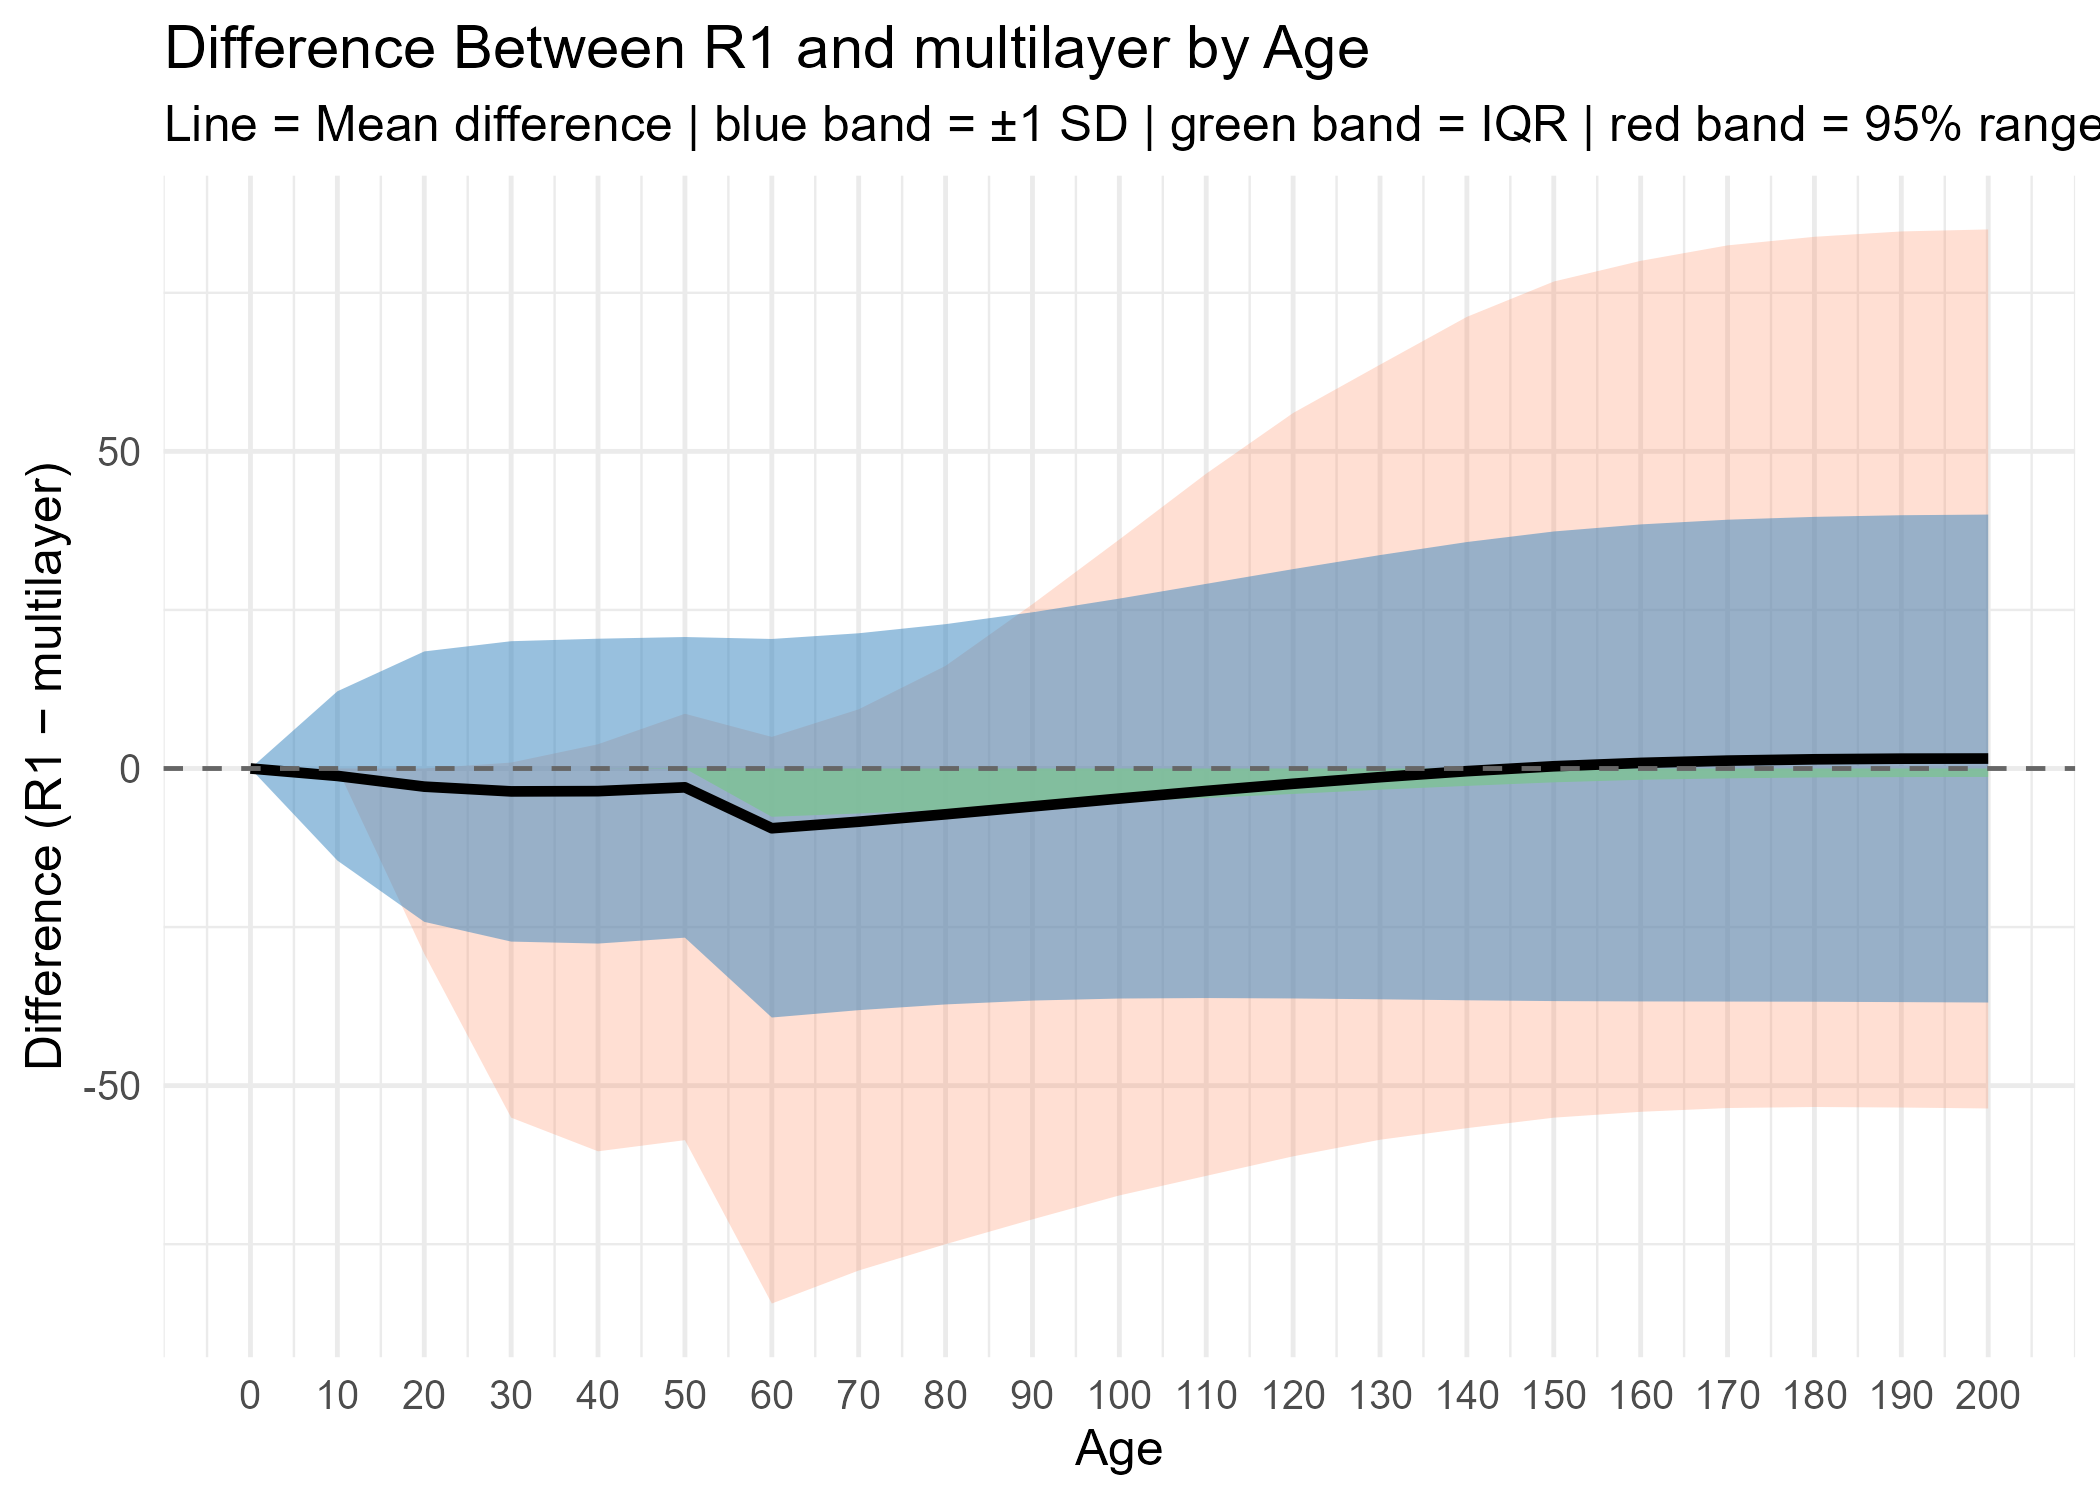
Mean live projected volume net dead, waste and breakage (PRJ_VOL_DWB) across projected stand age were calculated from the live layers that were projected in the multiple-layer projection, and the results were compared with R1-only projection. The mean PRJ_VOL_DWB was very similar between the two projections, with the multiple-layer projection generally producing slightly higher mean values at younger ages and converging with the R1-only projection at older ages (Figure 1 and Figure 2). Even though mean PRJ_VOL_DWB was close, the individual differences can vary widely in both positive and negative directions and the variation increases over projected age (Figure 3).
Figure 1. Mean PRJ_VOL_DWB by projected age
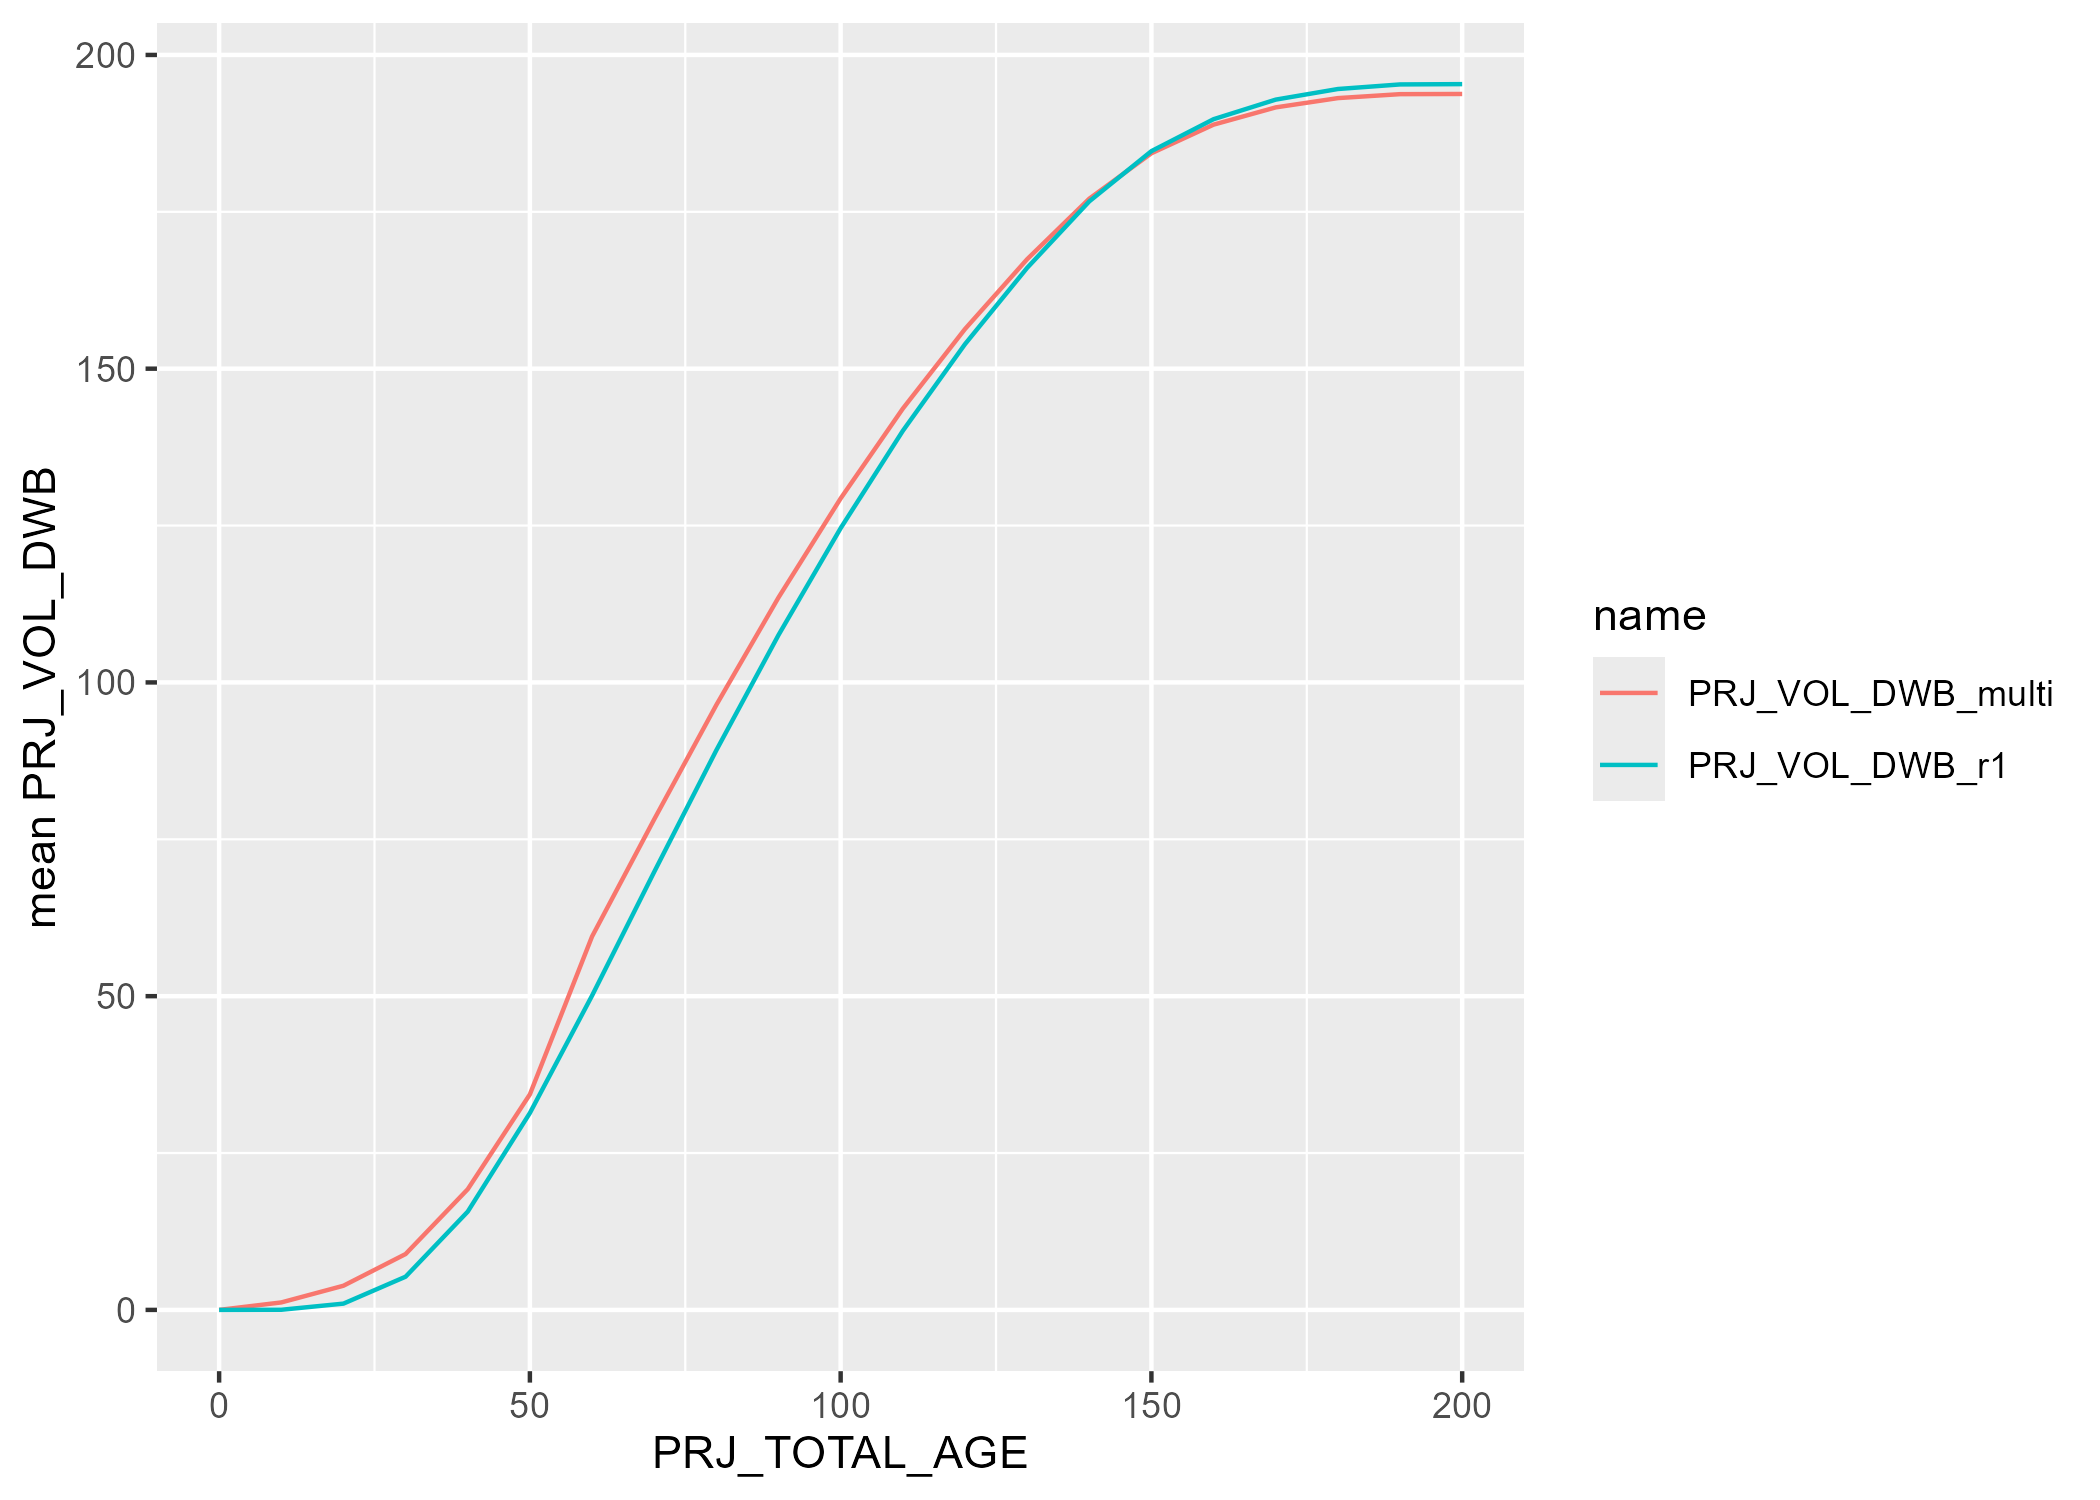
Figure 2. Mean differences of PRJ_VOL_DWB by projected age
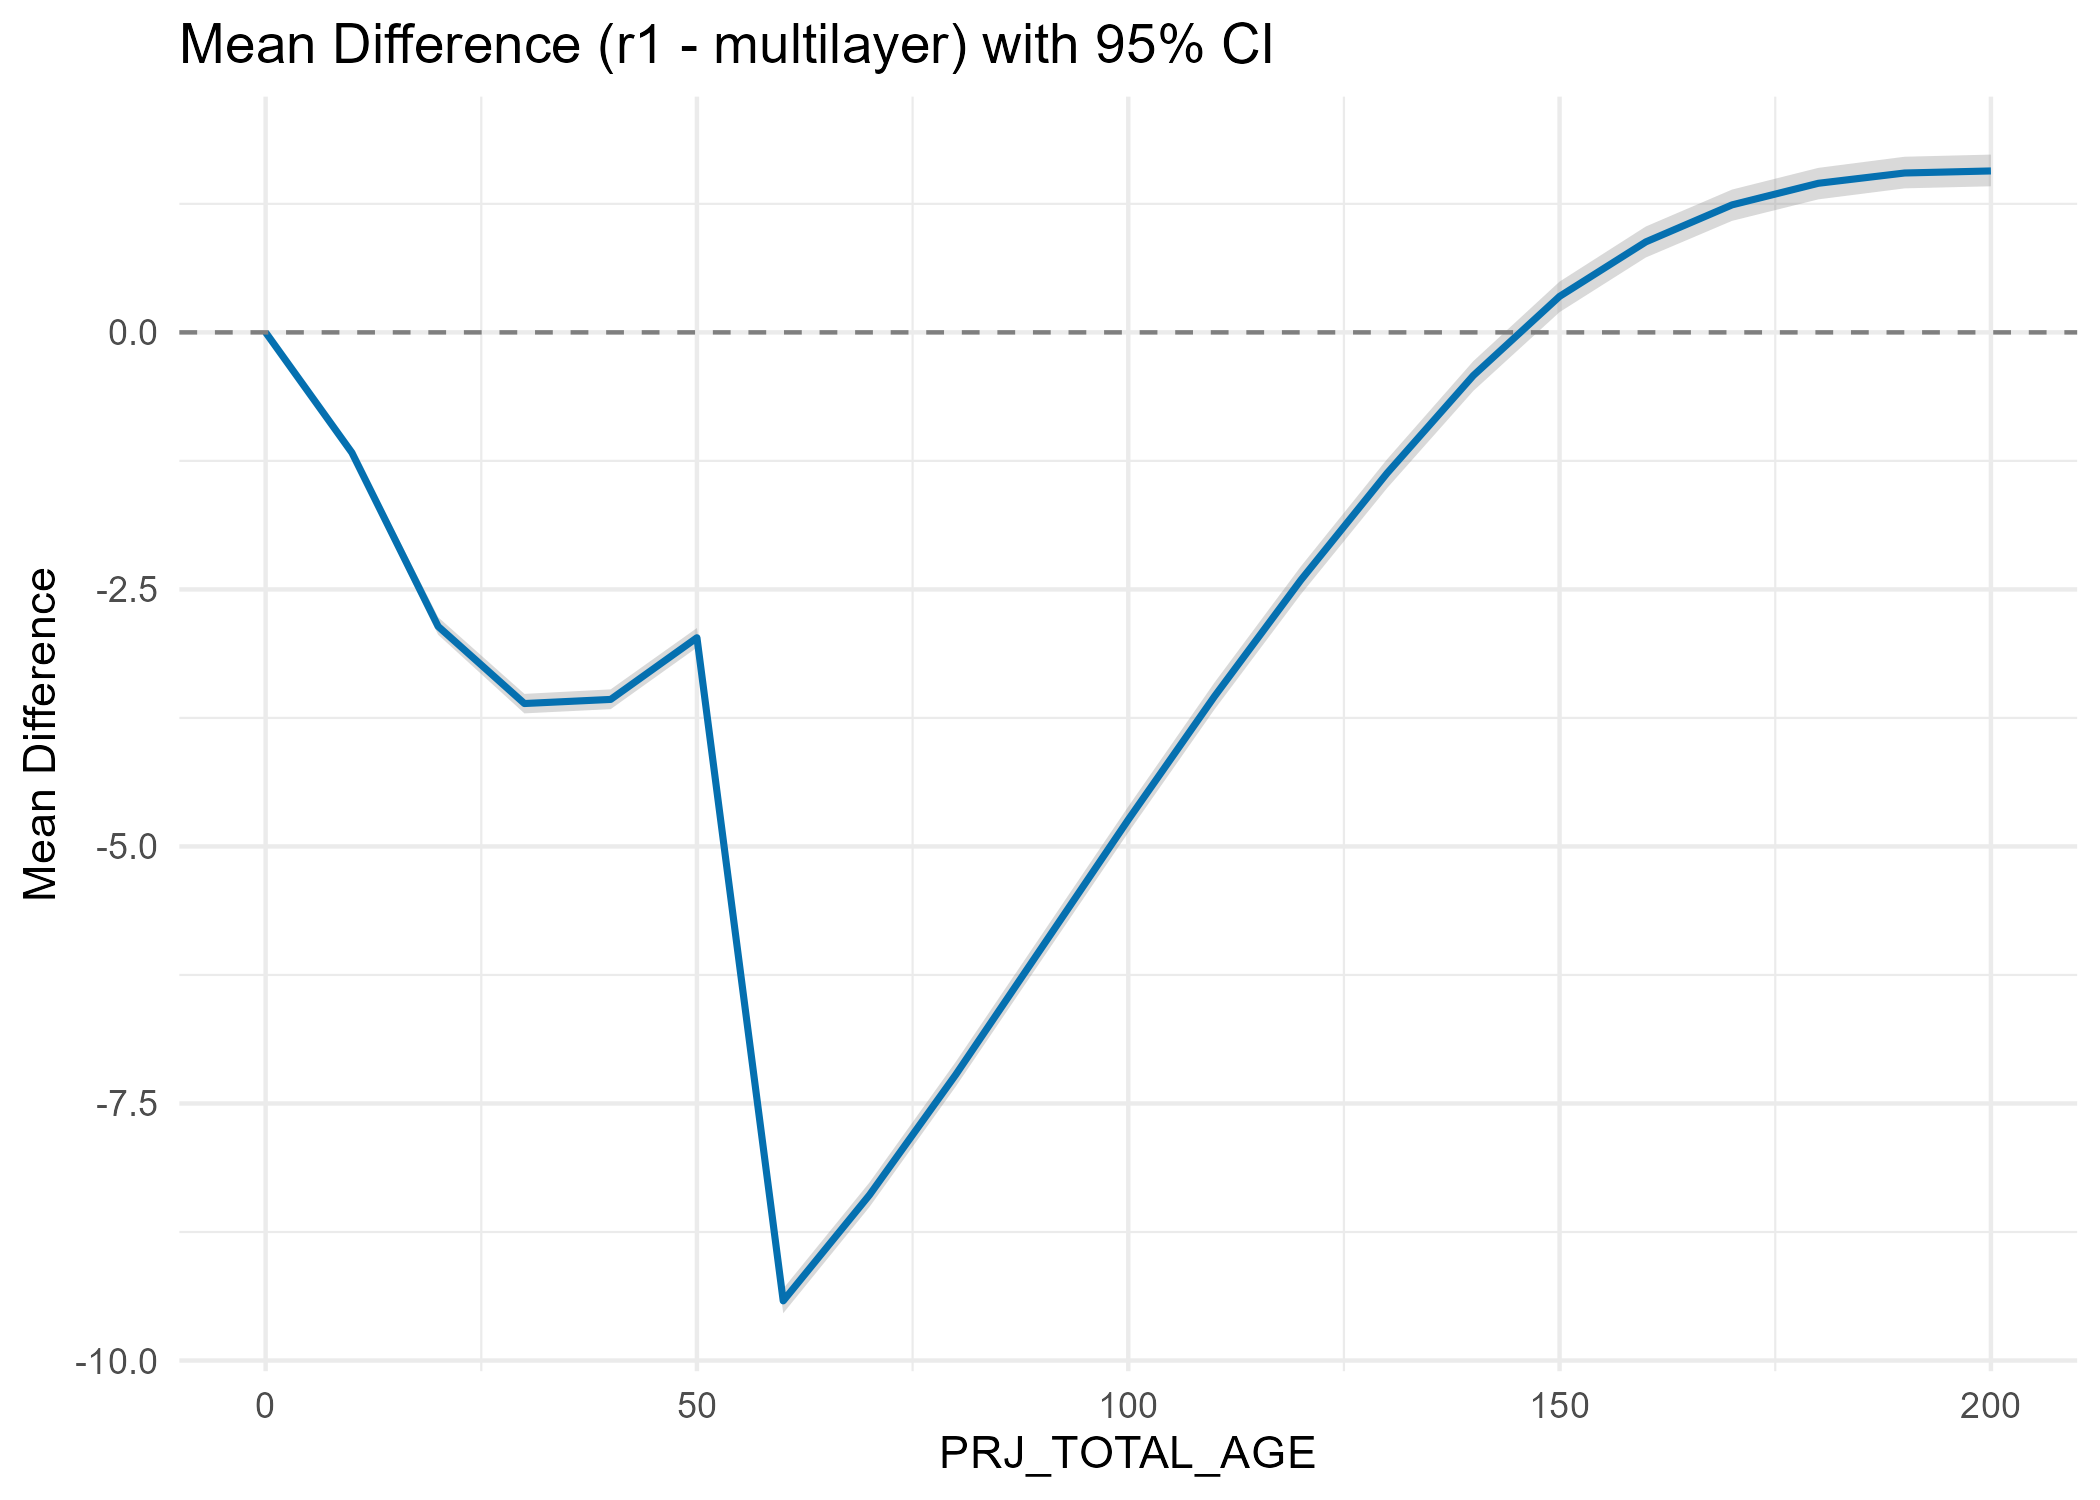
Figure 3. Variation of PRJ_VOL_DWB by projected age
7.2 set2. r1 only vs multilayer set2 (only containing P layer and D layer)
Number of multi-layer polygons that were included in this comparison: 811118
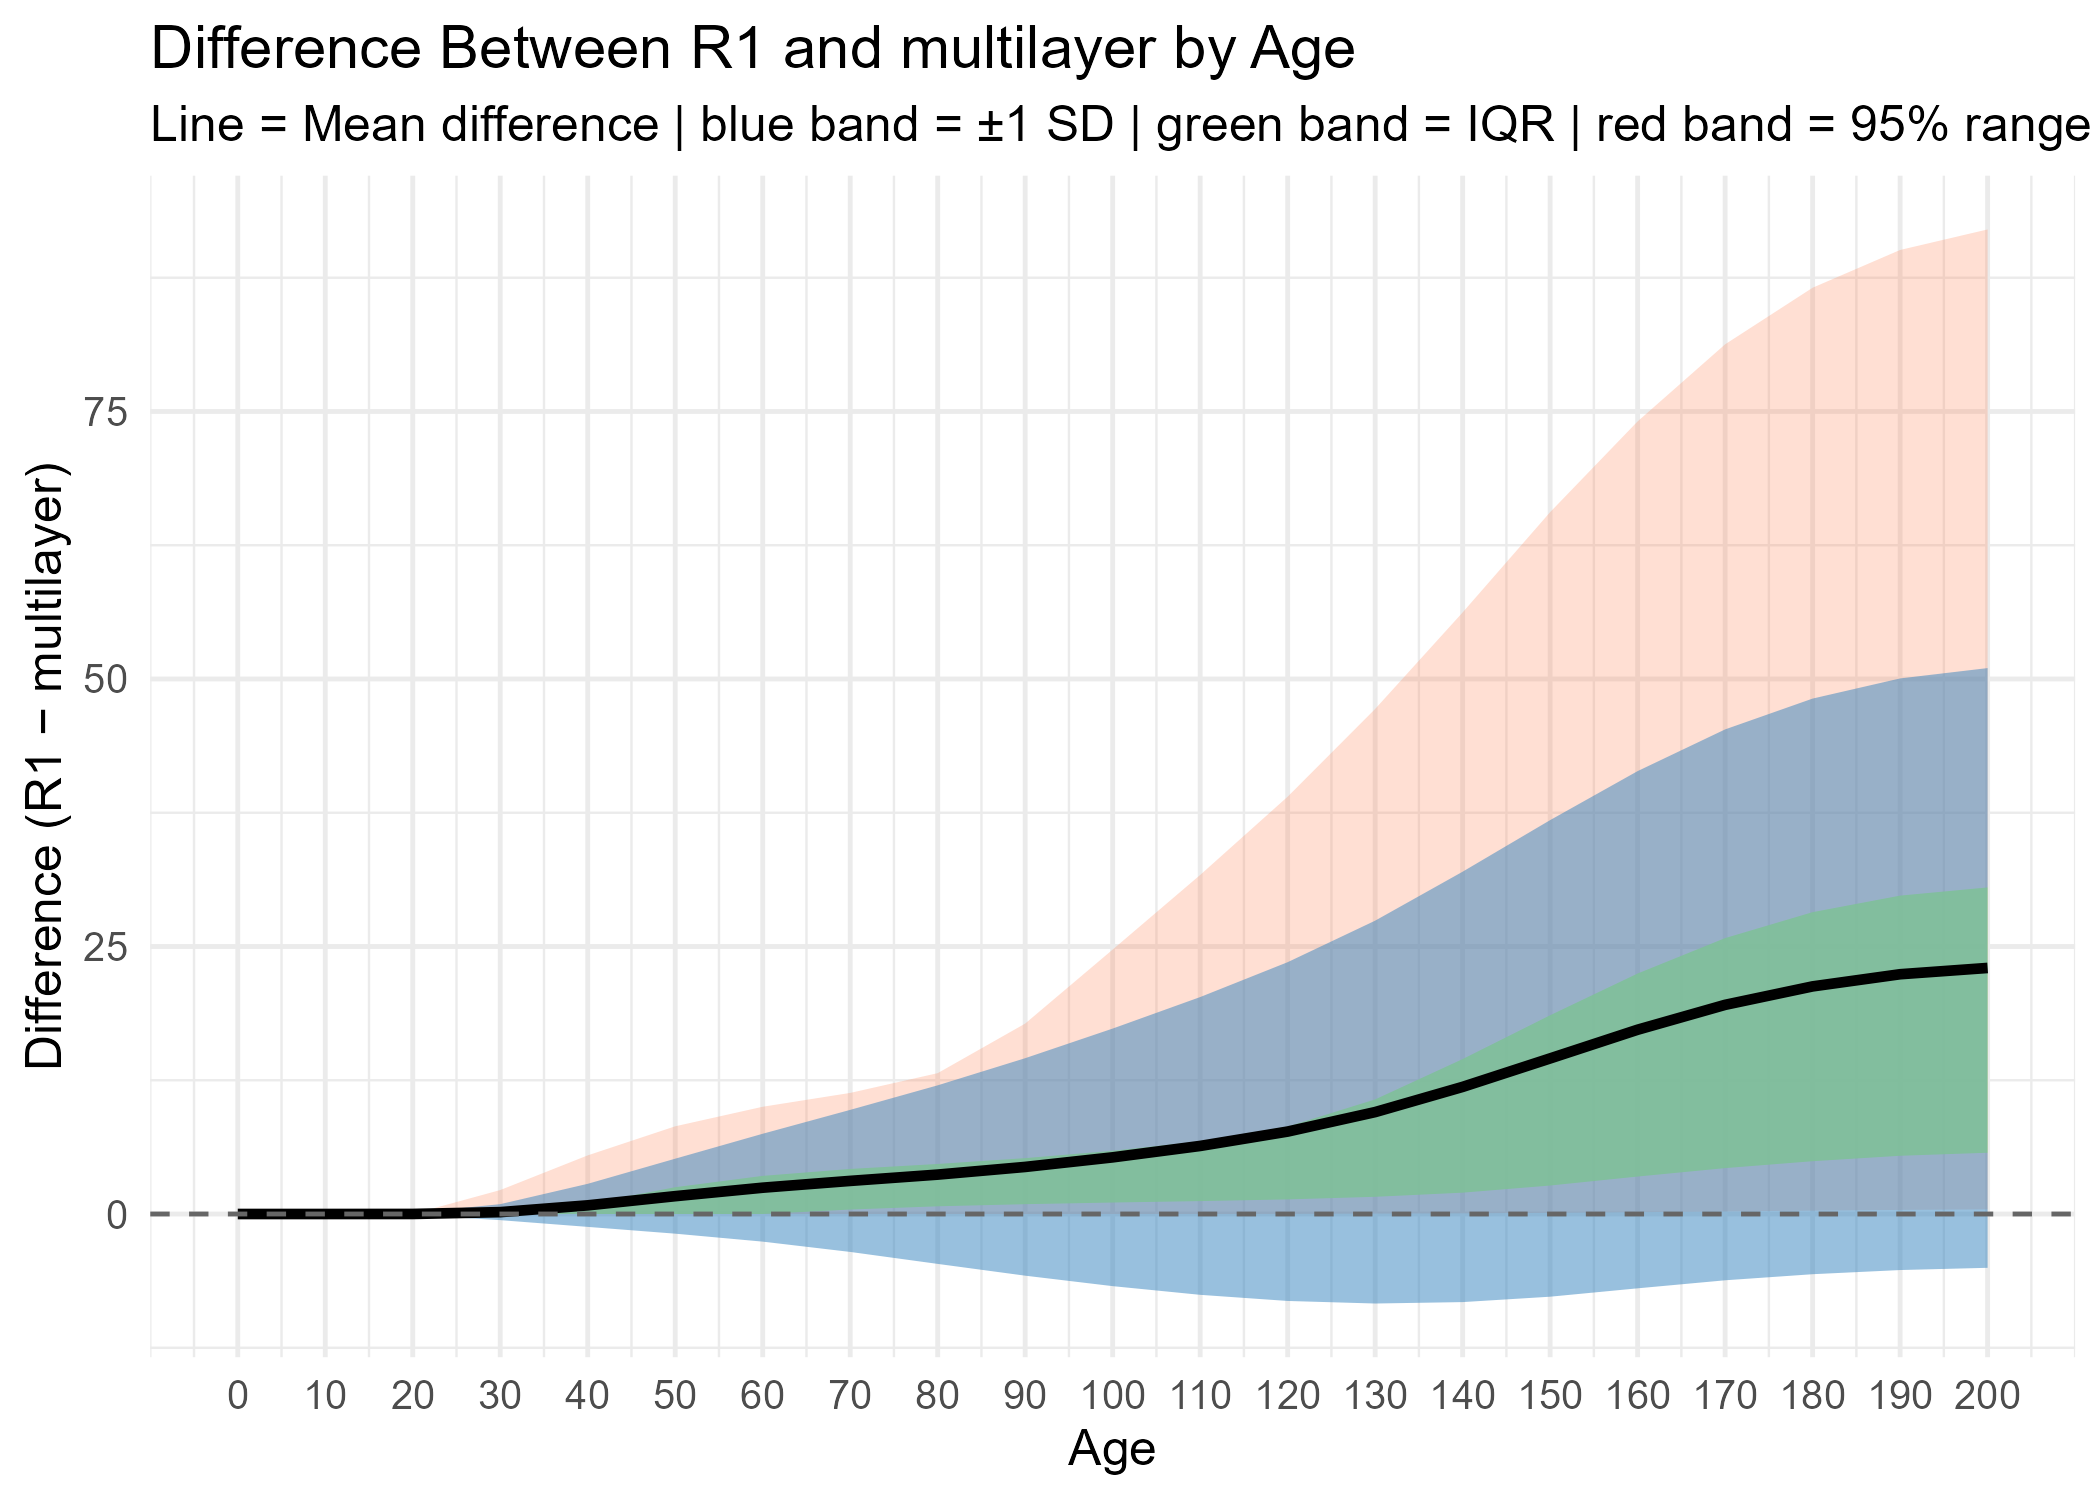
The projection of P layer from multiple-layer set 2, of which each polygon contains one P layer and one D layer, was compared with R1-only projection. “R1-only” projection produces consistently higher mean PRJ_VOL_DWB than multiple-layer projection after approximately age 25, and the mean differences increased with the increase of projected age (Figure 4 and Figure 5). Individual differences varied widely mainly in the positive direction and the variation increases over projected age (Figure 6).
Figure 4. Mean PRJ_VOL_DWB by projected age
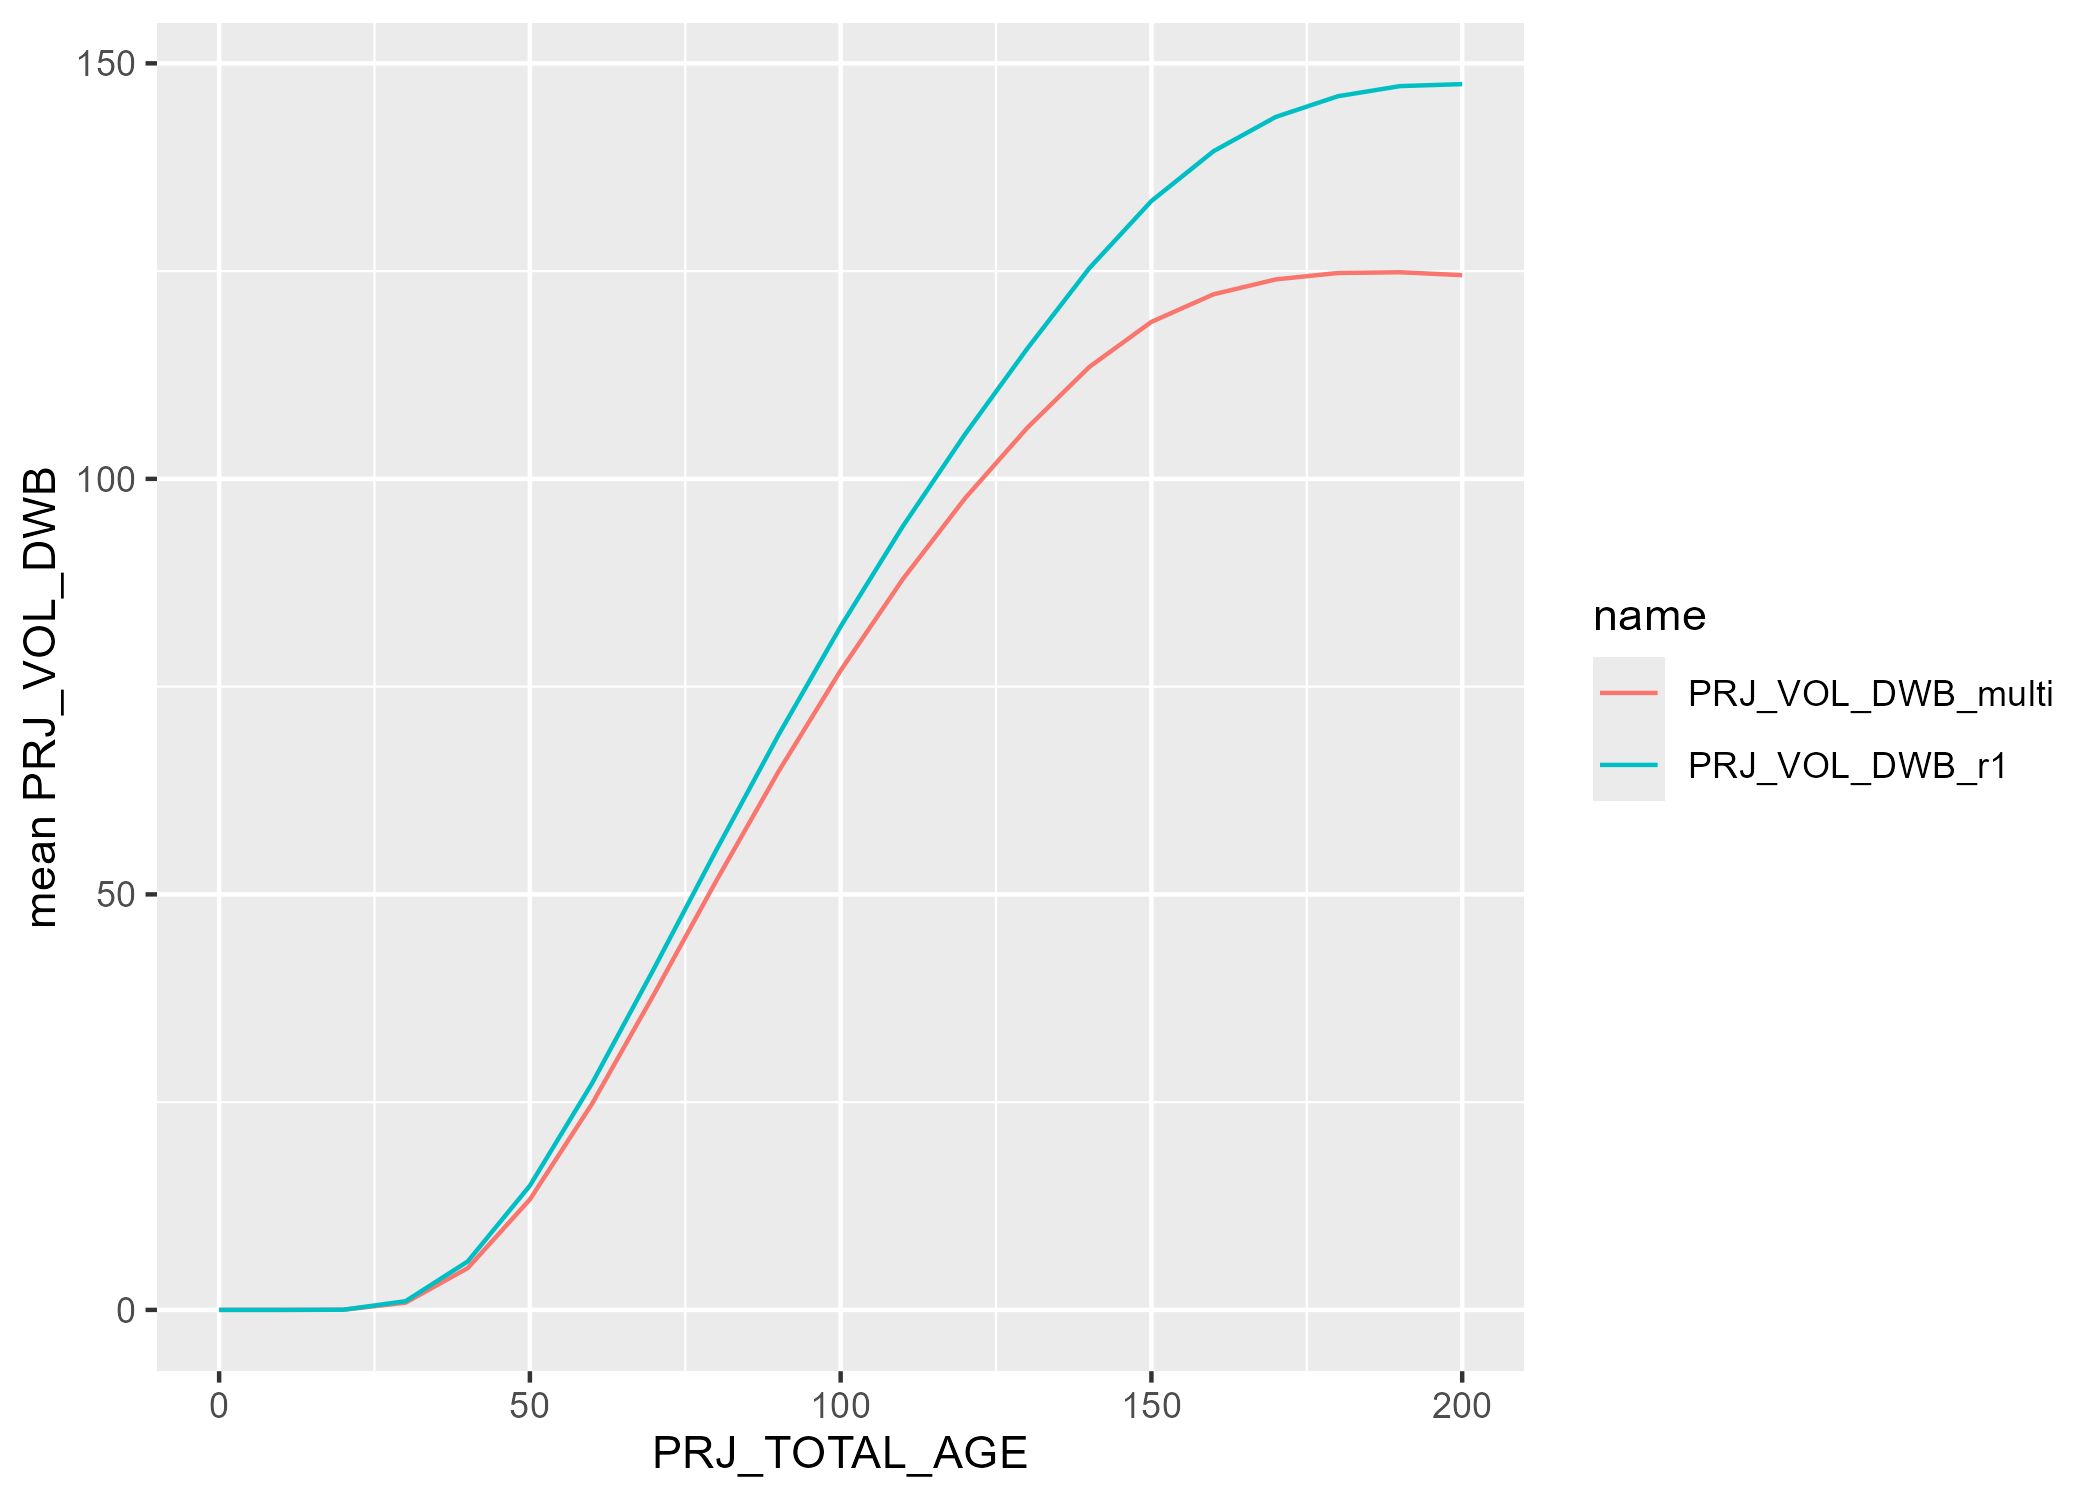
Figure 5. Mean differences of PRJ_VOL_DWB by projected age
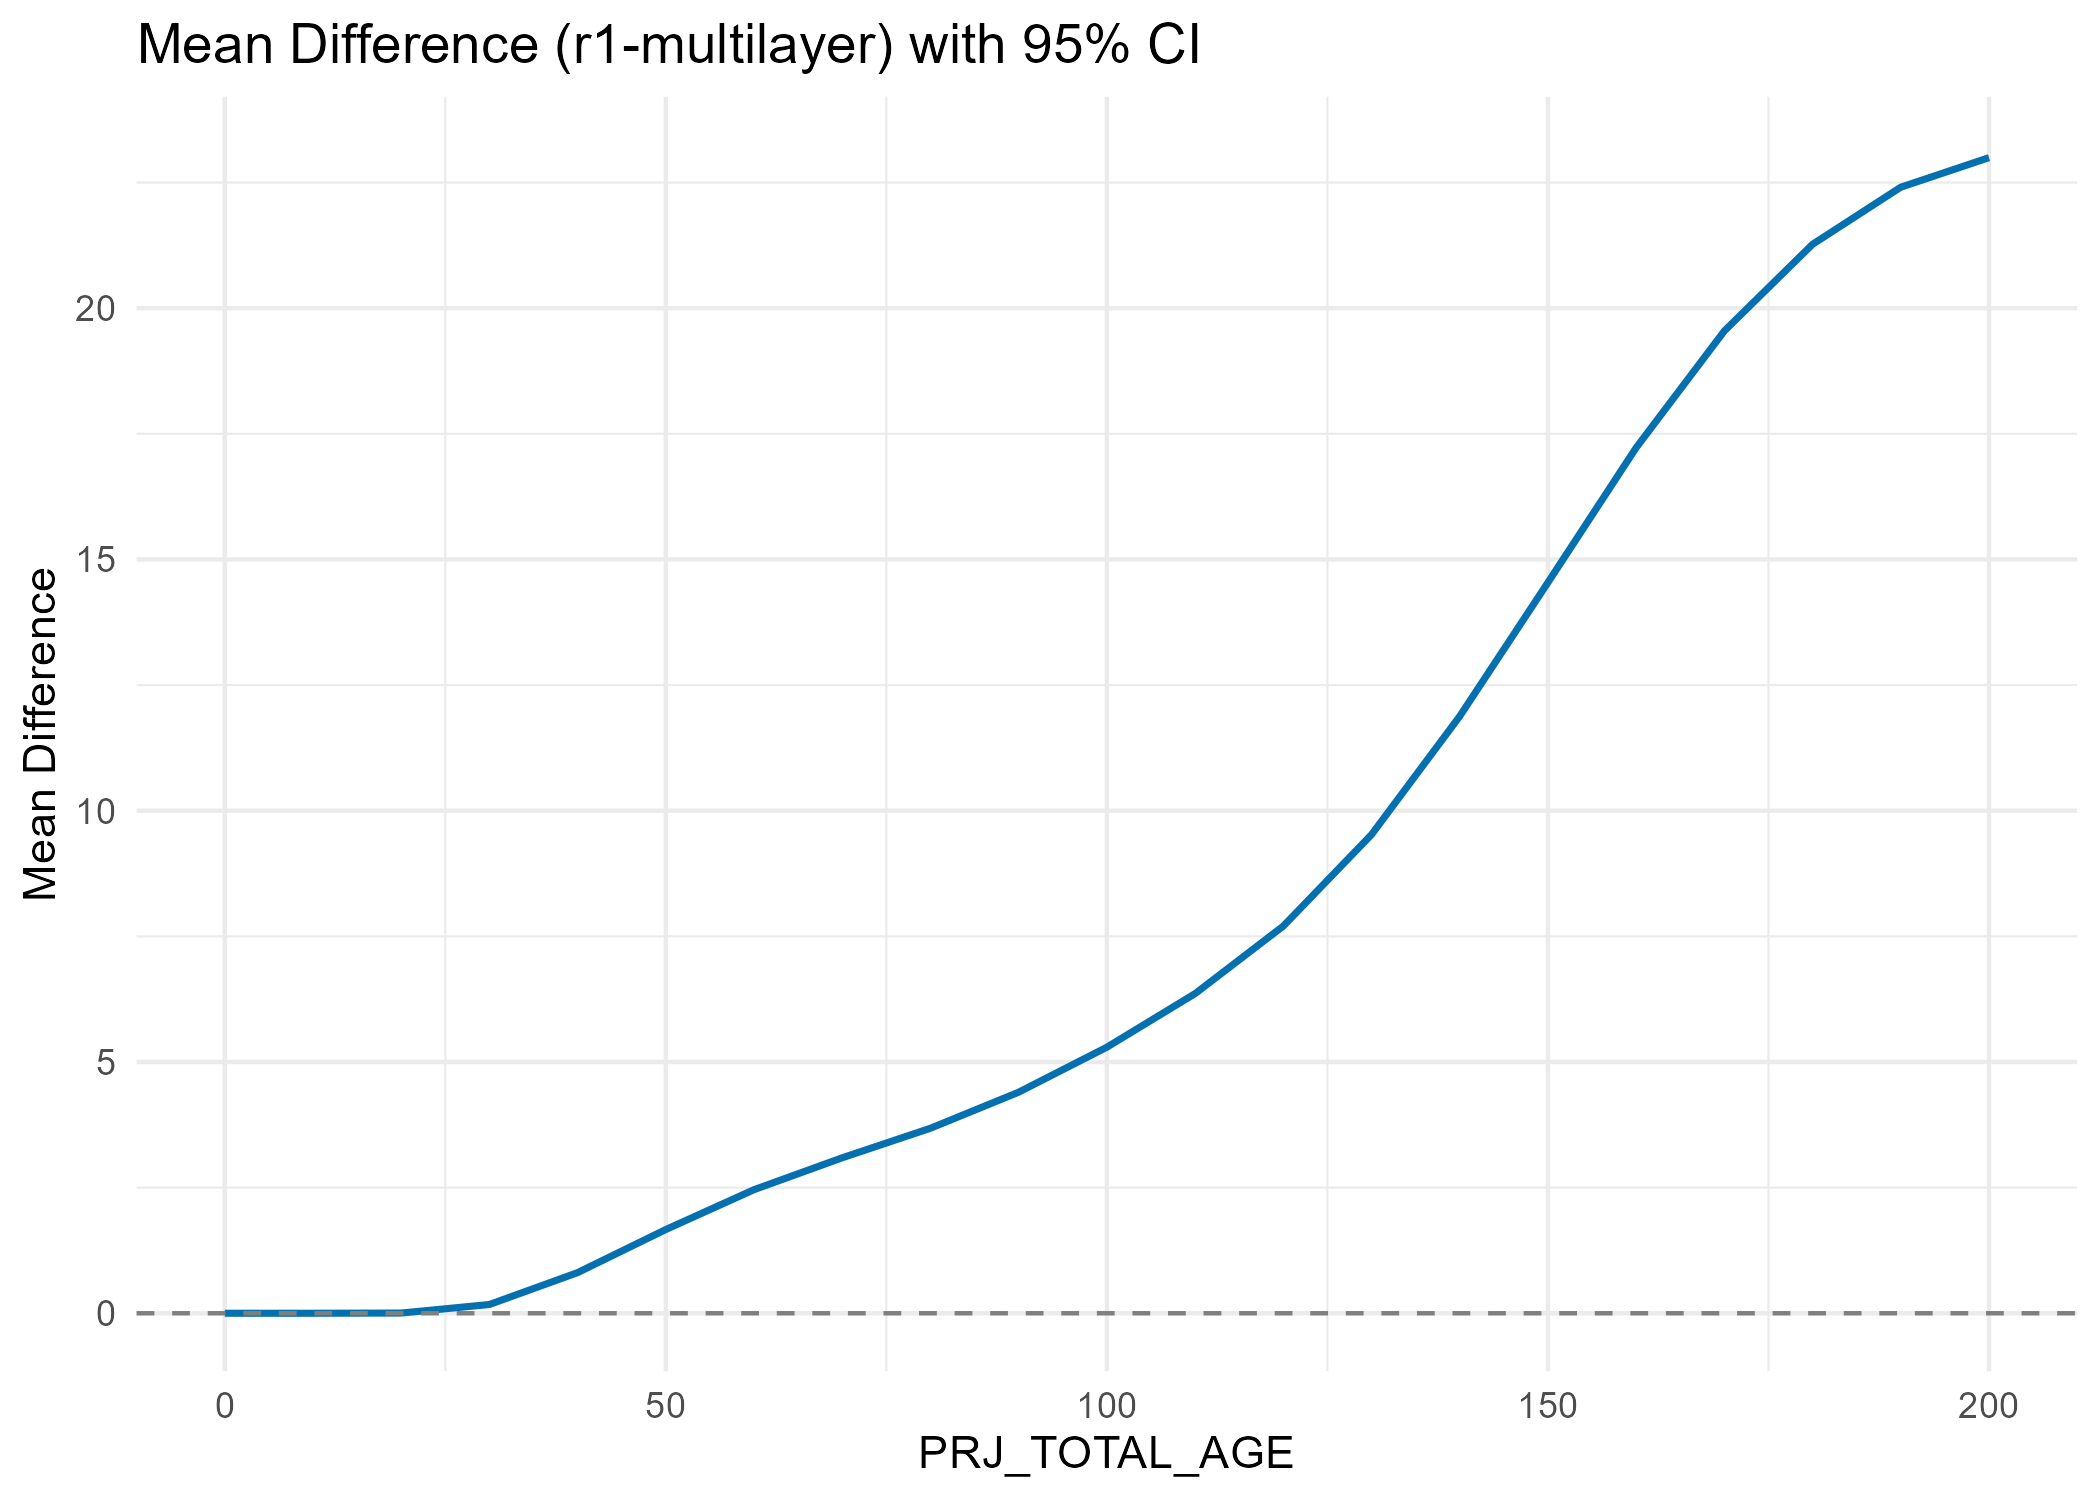
Figure 6. Variation of PRJ_VOL_DWB by projected age
7.3 Overall - one-layer polygons + multiple-layer polygons (set1+set2)
Mean live PRJ_VOL_DWB were calculated by averaging the PRJ_VOL_DWB from all polygons provincially, including single layer polygons and multiple layers polygons, and compared with R1-only projection. At the provincial scale, The differences is not significant with the largest differences from this test is around 3m3/ha at age 200 (Figure 8 & Table 2).
Figure 7. Mean PRJ_VOL_DWB after combining provincial polygons
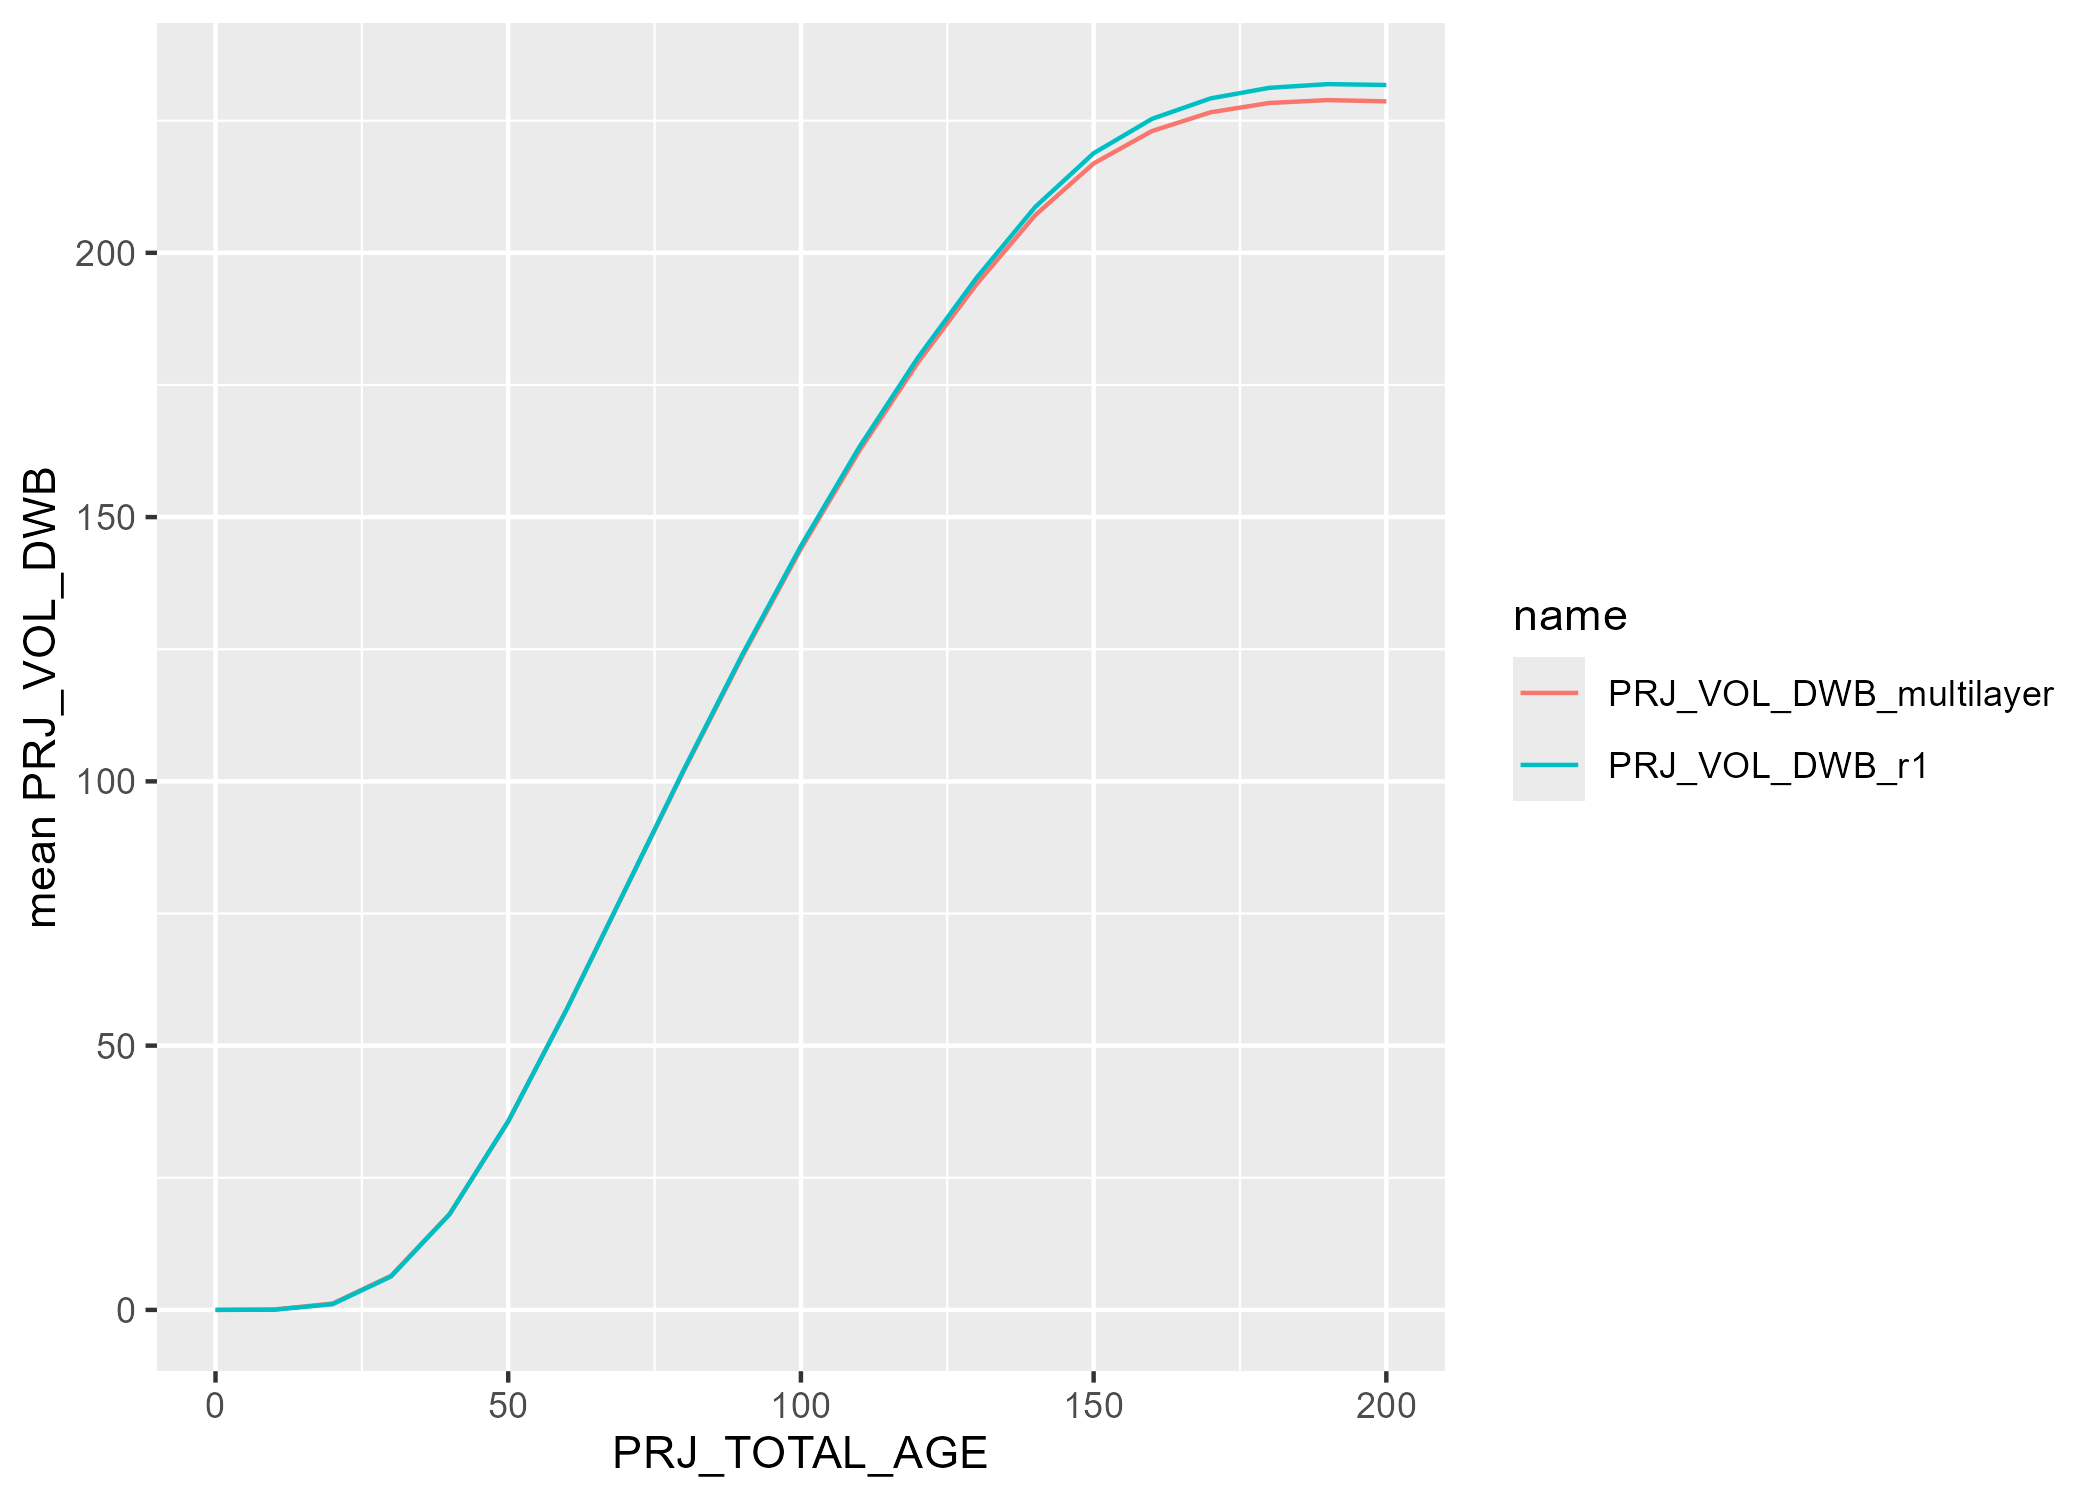
Figure 8. Mean differences(R1 only projection - multilayer projection) after combining all polygons
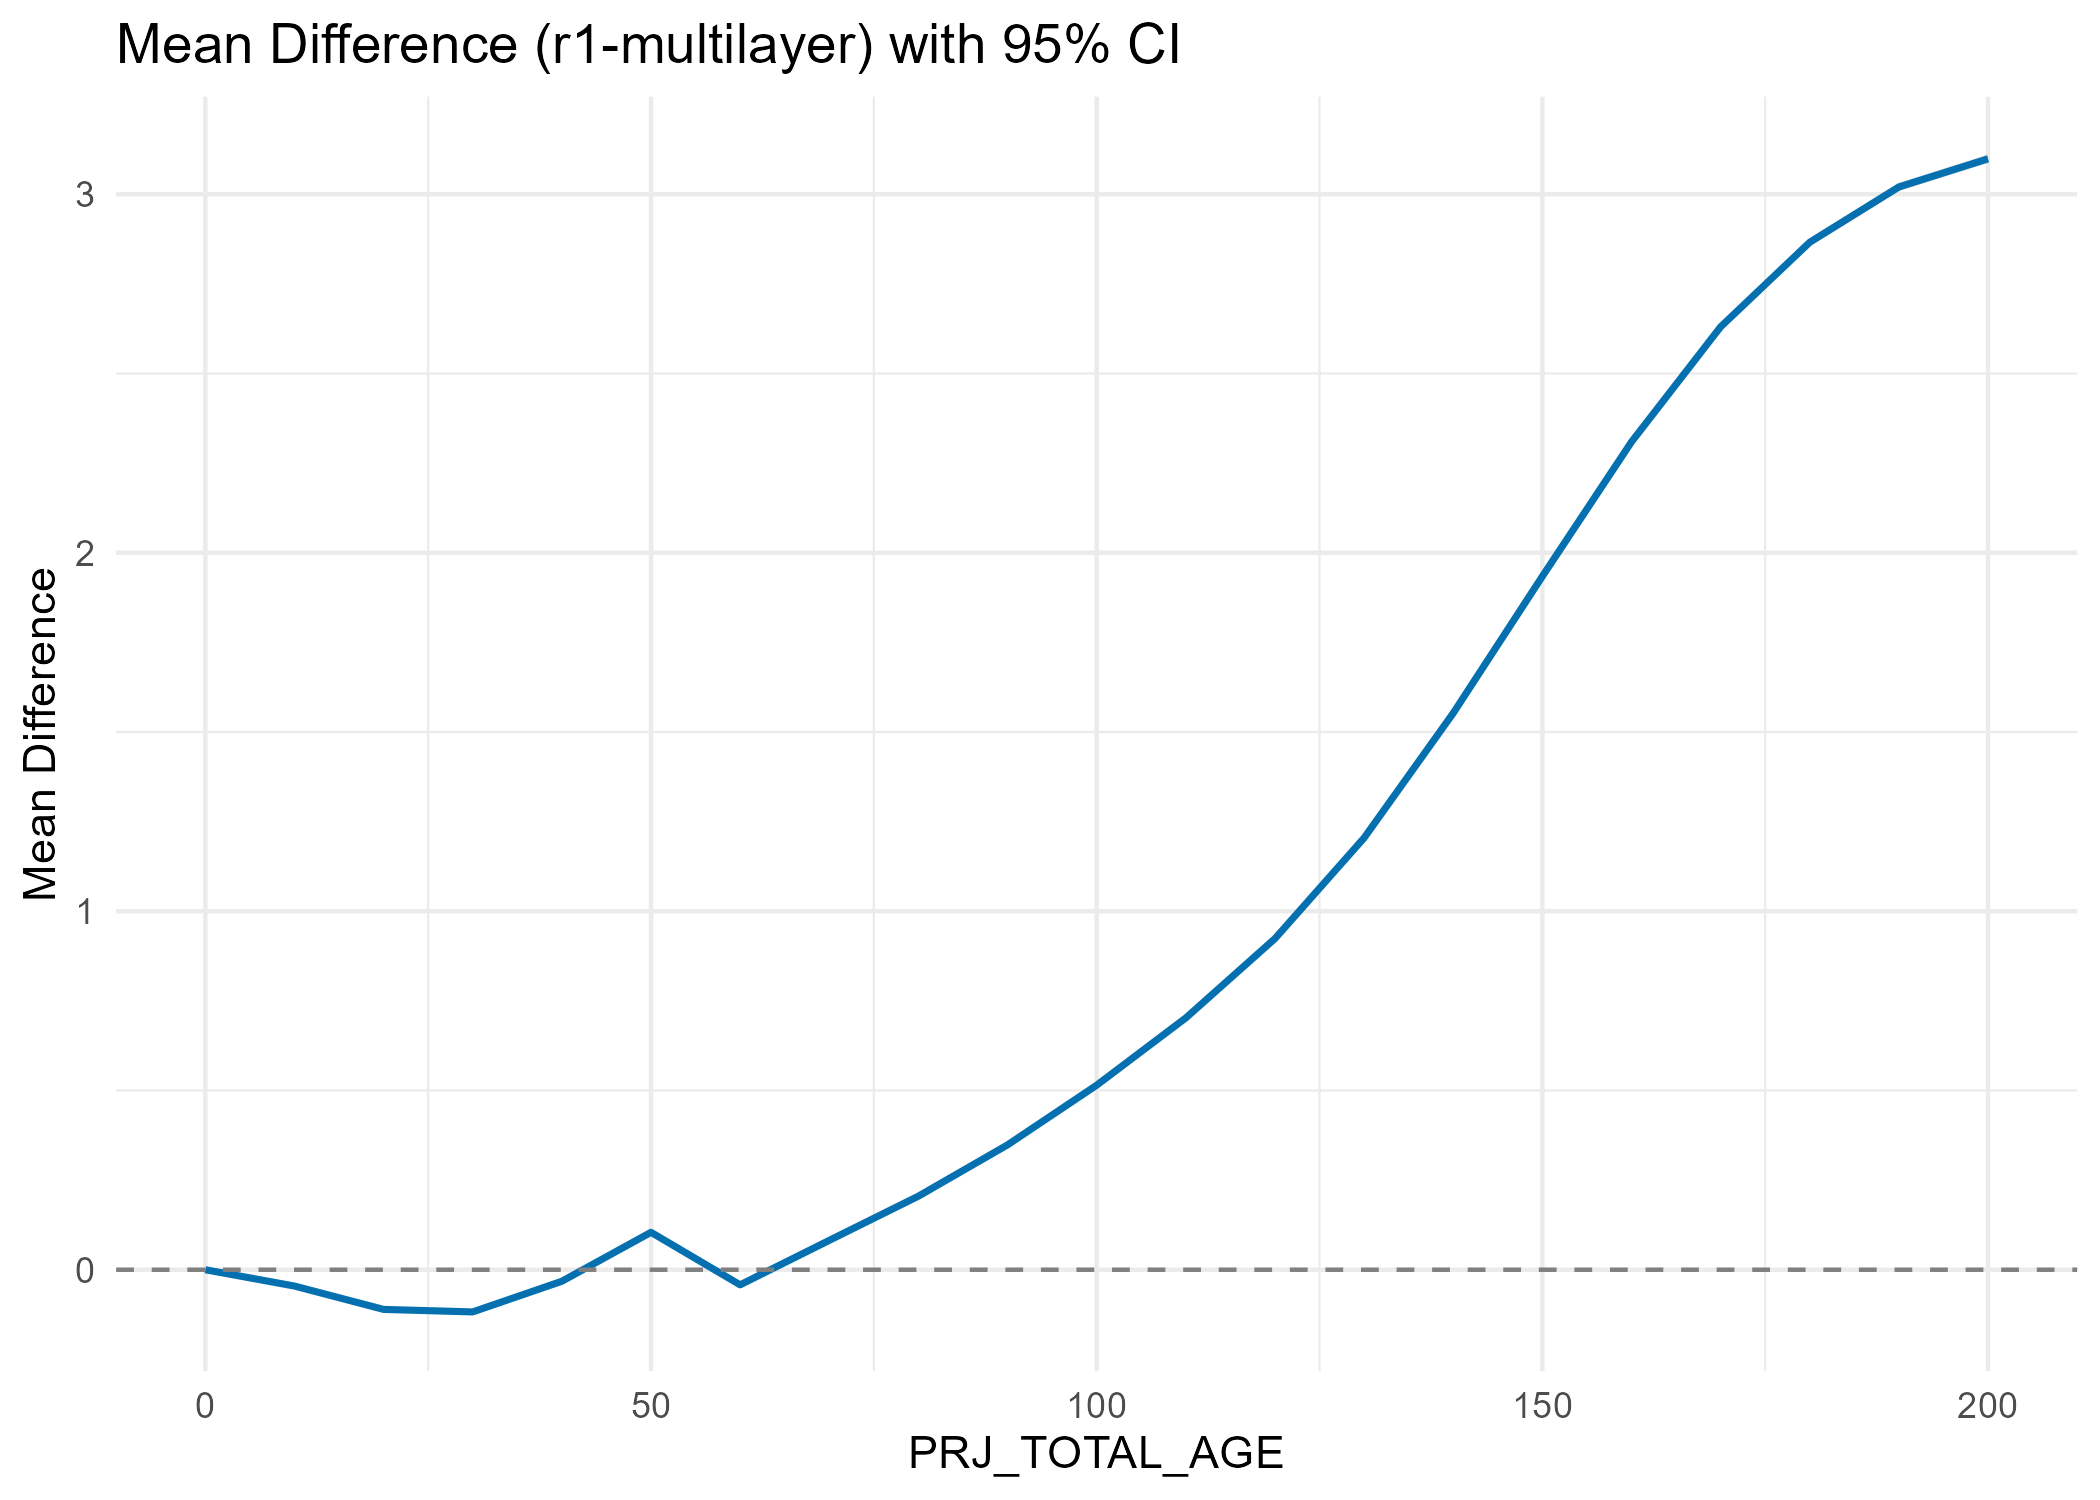
Table 2. statistic summary table of all polygons
| PRJ_TOTAL_AGE | PRJ_VOL_DWB_r1 | PRJ_VOL_DWB_multilayer | mean_diff | p_value | conf_low | conf_high |
|---|---|---|---|---|---|---|
| 0 | 0.0000043 | 0.0000043 | 0.0000000 | NaN | NaN | NaN |
| 10 | 0.0281453 | 0.0736559 | -0.0455105 | 0 | -0.0476008 | -0.0434203 |
| 20 | 1.0852617 | 1.1959393 | -0.1106776 | 0 | -0.1140340 | -0.1073213 |
| 30 | 6.3378247 | 6.4554847 | -0.1176600 | 0 | -0.1214046 | -0.1139154 |
| 40 | 18.1189195 | 18.1510706 | -0.0321511 | 0 | -0.0359946 | -0.0283075 |
| 50 | 35.7041697 | 35.5997730 | 0.1043967 | 0 | 0.1005060 | 0.1082875 |
| 60 | 56.8703606 | 56.9124880 | -0.0421274 | 0 | -0.0472716 | -0.0369831 |
| 70 | 79.5466662 | 79.4647204 | 0.0819458 | 0 | 0.0766872 | 0.0872043 |
| 80 | 102.2248499 | 102.0196341 | 0.2052158 | 0 | 0.1997373 | 0.2106943 |
| 90 | 124.0115760 | 123.6633117 | 0.3482643 | 0 | 0.3424540 | 0.3540745 |
| 100 | 144.5266269 | 144.0118668 | 0.5147601 | 0 | 0.5085241 | 0.5209962 |
| 110 | 163.2818778 | 162.5794821 | 0.7023957 | 0 | 0.6956641 | 0.7091272 |
| 120 | 180.1846673 | 179.2610162 | 0.9236511 | 0 | 0.9163616 | 0.9309406 |
| 130 | 195.2633307 | 194.0588249 | 1.2045058 | 0 | 1.1965708 | 1.2124409 |
| 140 | 208.6505357 | 207.0979542 | 1.5525815 | 0 | 1.5438993 | 1.5612637 |
| 150 | 218.8410095 | 216.9068308 | 1.9341787 | 0 | 1.9247177 | 1.9436398 |
| 160 | 225.3601844 | 223.0510313 | 2.3091530 | 0 | 2.2989591 | 2.3193469 |
| 170 | 229.2210614 | 226.5909221 | 2.6301394 | 0 | 2.6193135 | 2.6409652 |
| 180 | 231.2160737 | 228.3500062 | 2.8660675 | 0 | 2.8547676 | 2.8773673 |
| 190 | 231.9197136 | 228.8994187 | 3.0202949 | 0 | 3.0086807 | 3.0319092 |
| 200 | 231.7569251 | 228.6581189 | 3.0988063 | 0 | 3.0870294 | 3.1105831 |