If by = NULL plot_timeseries returns a ggplot object.
Otherwise it returns a list of ggplot objects.
plot_timeseries(
  data,
  by = NULL,
  y0 = TRUE,
  size = 1,
  messages = getOption("wqbc.messages", default = TRUE)
)
Arguments
- data
A data frame of the data to plot.
- by
A character vector of the columns to plot the time series by.
- y0
A flag indicating whether to expand the y-axis limits to include 0.
- size
A number of the point size.
- messages
A flag indicating whether to print messages.
Examples
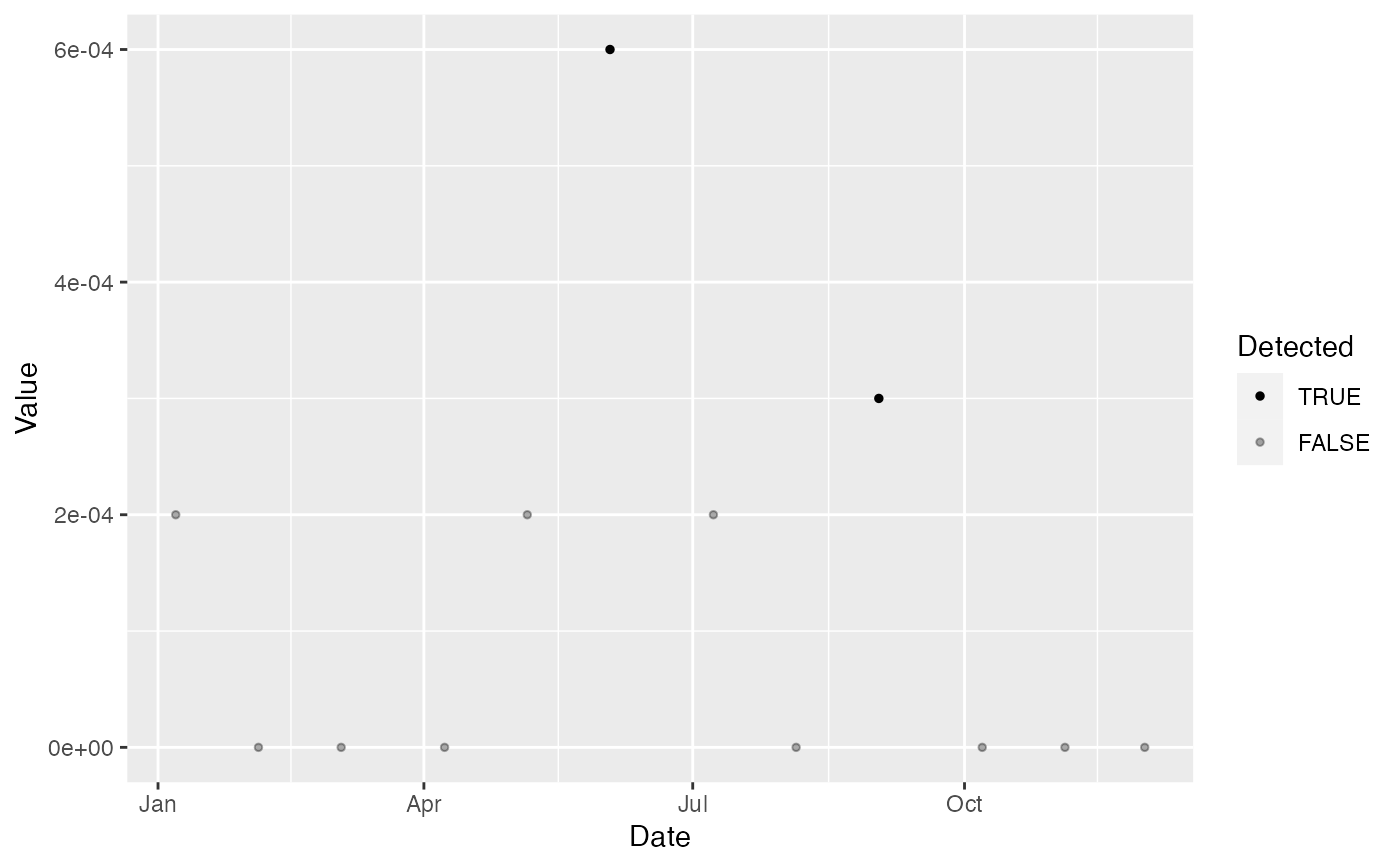
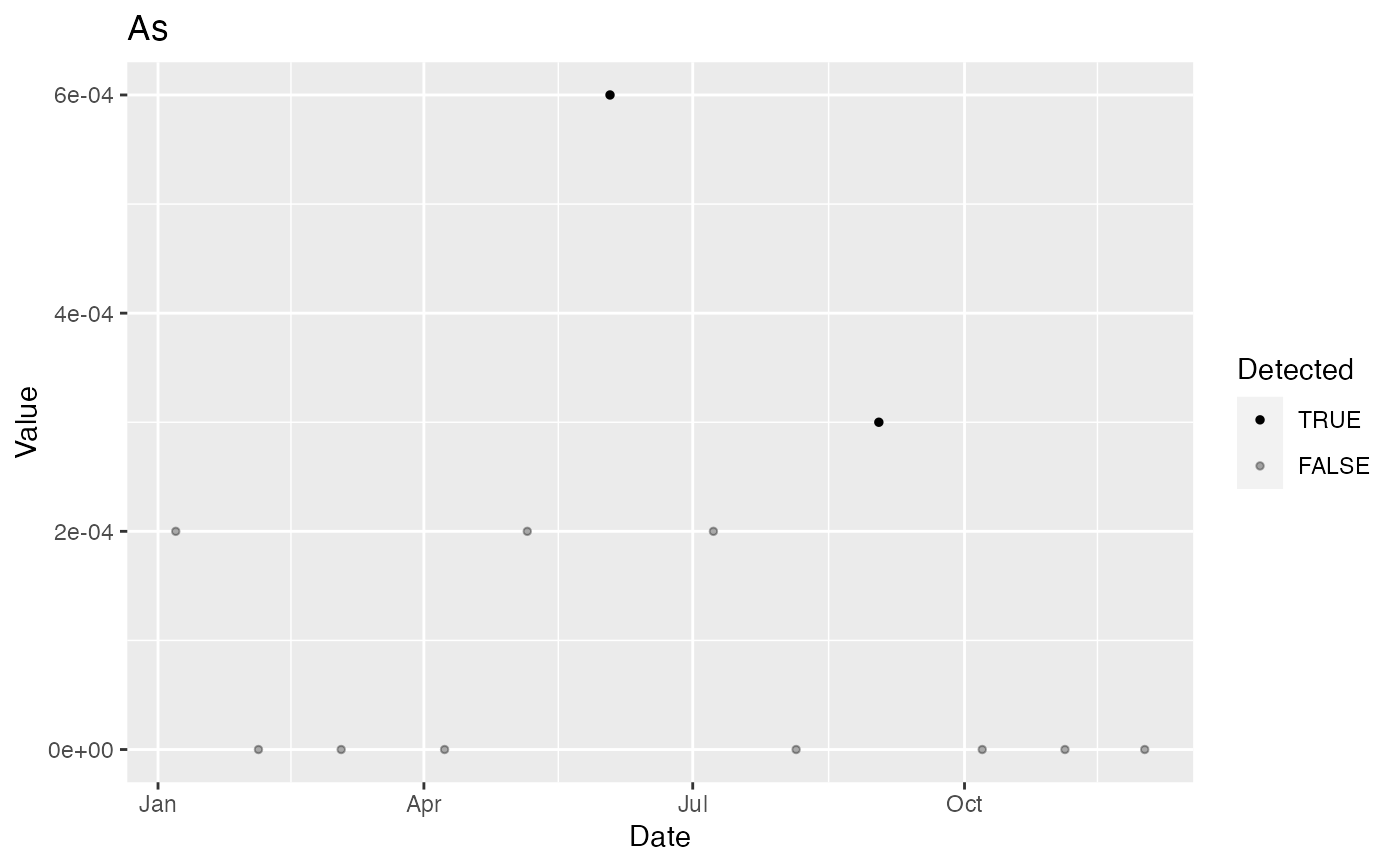
plot_timeseries(ccme[ccme$Variable == "As", ])
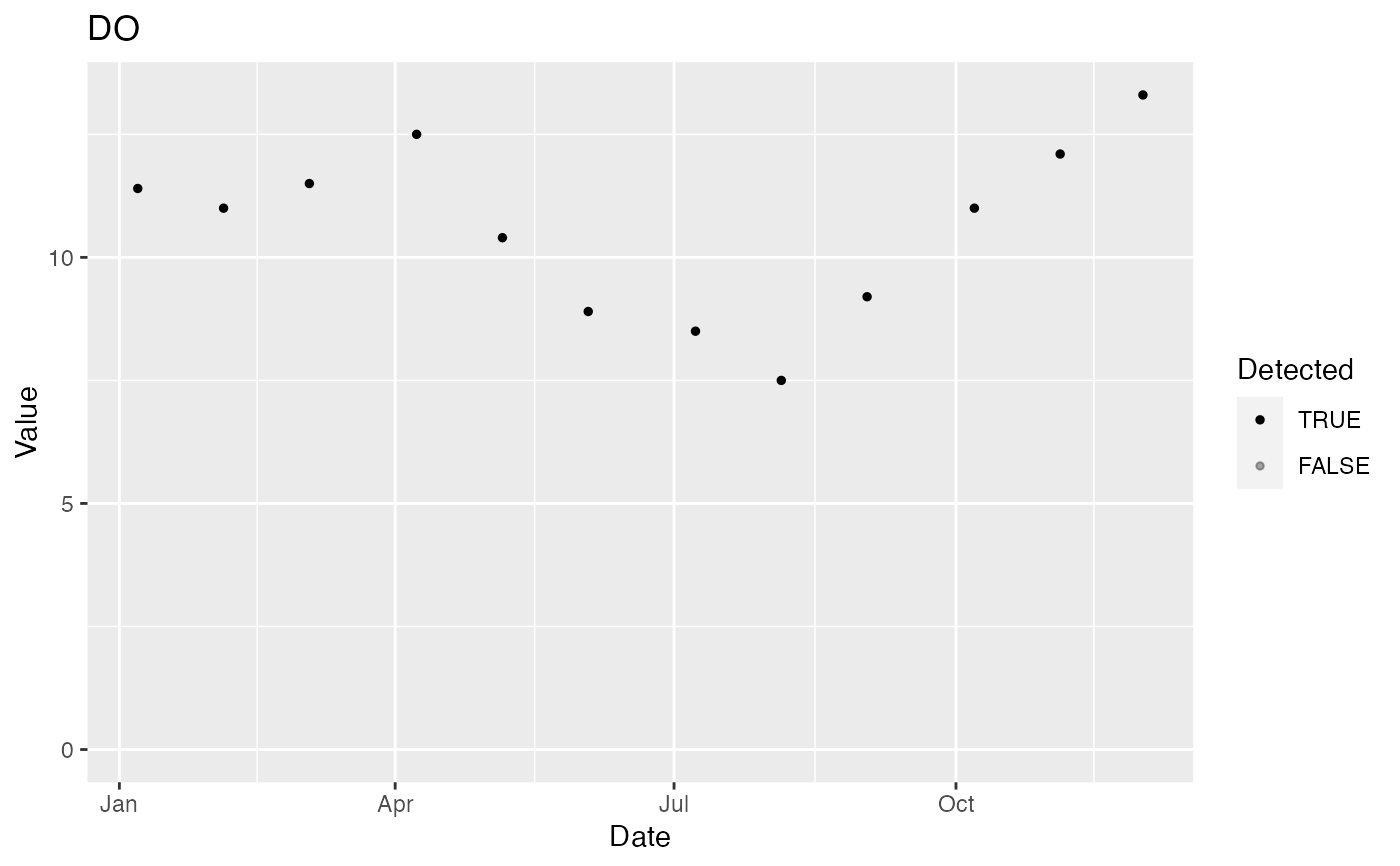
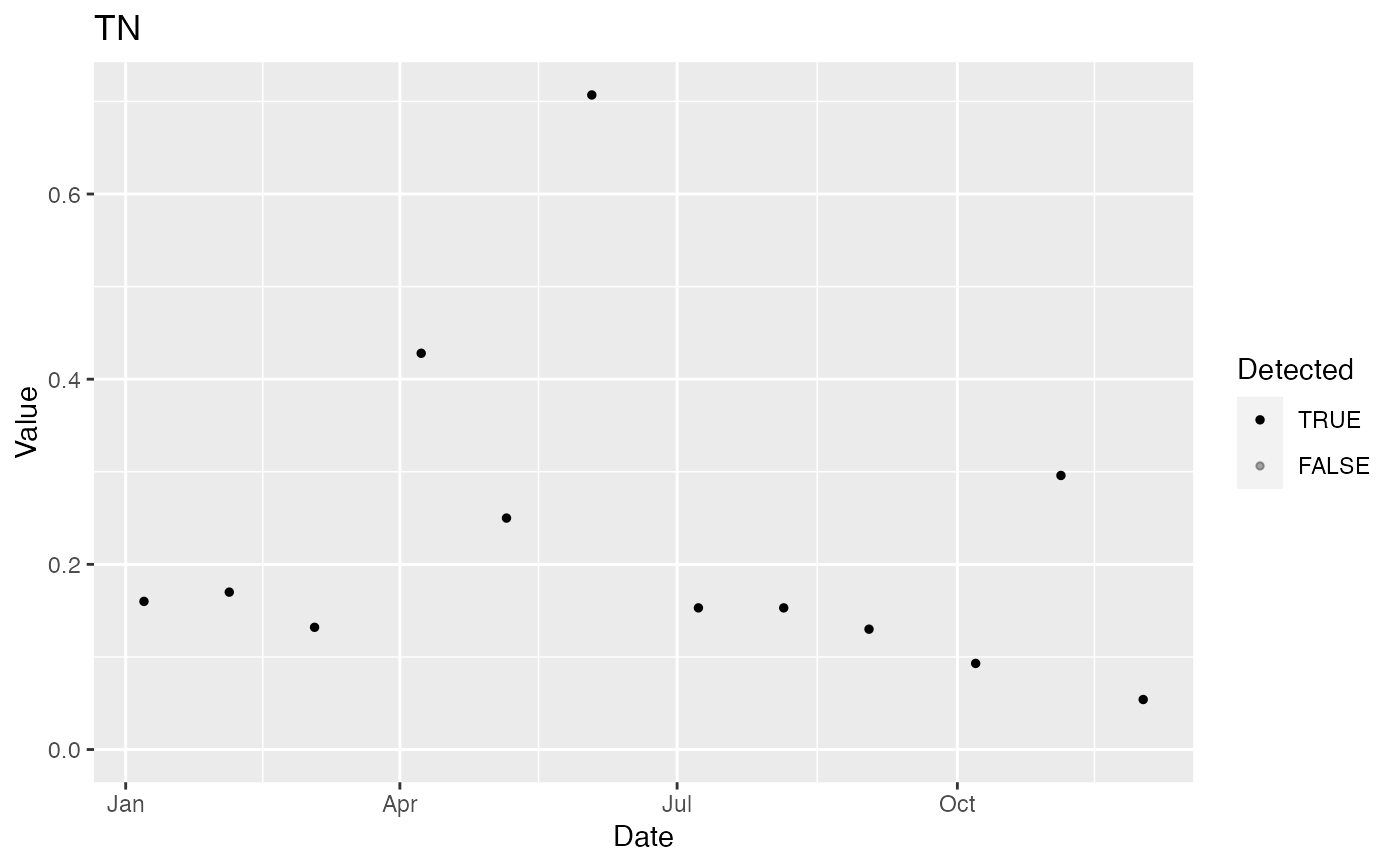
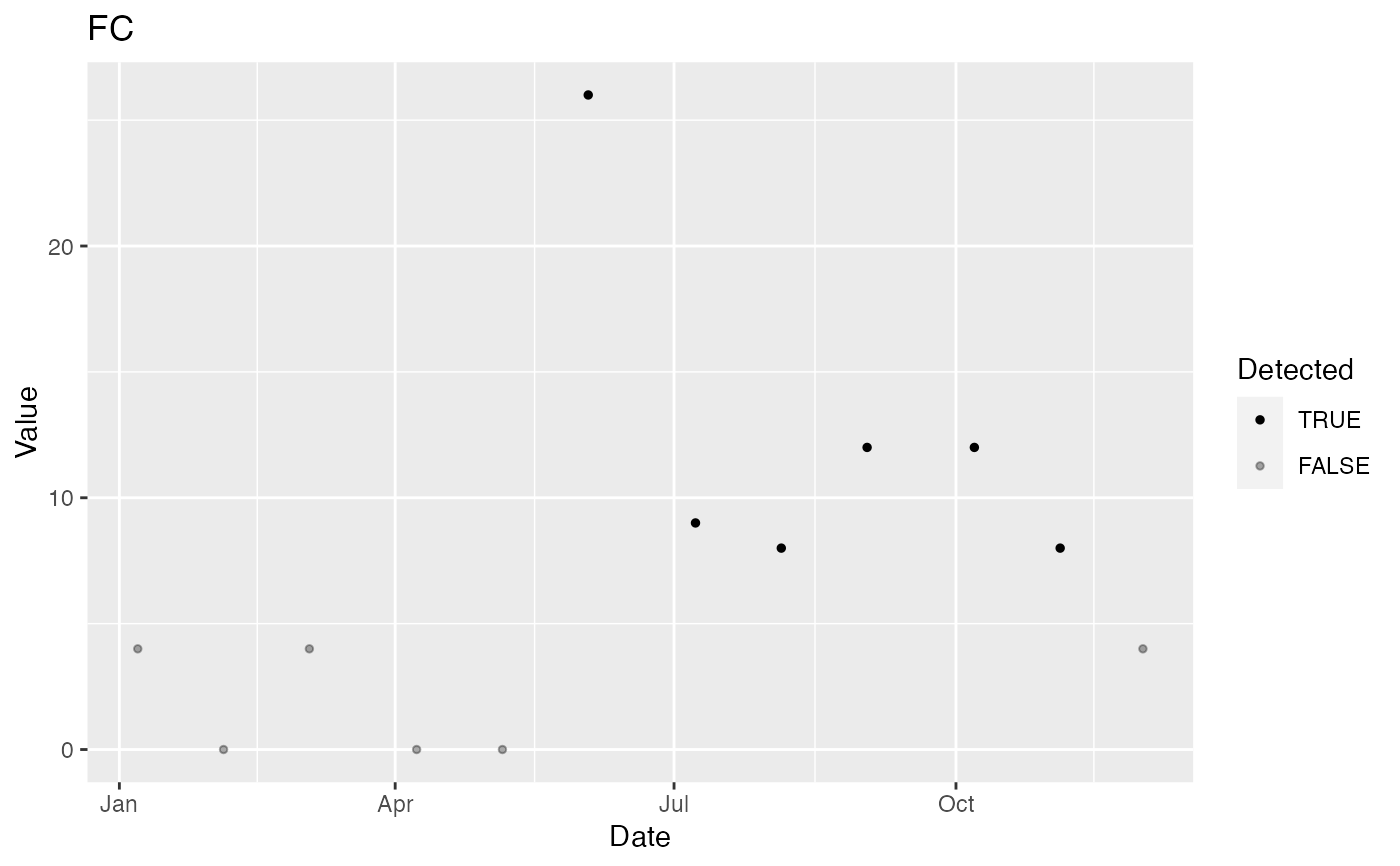
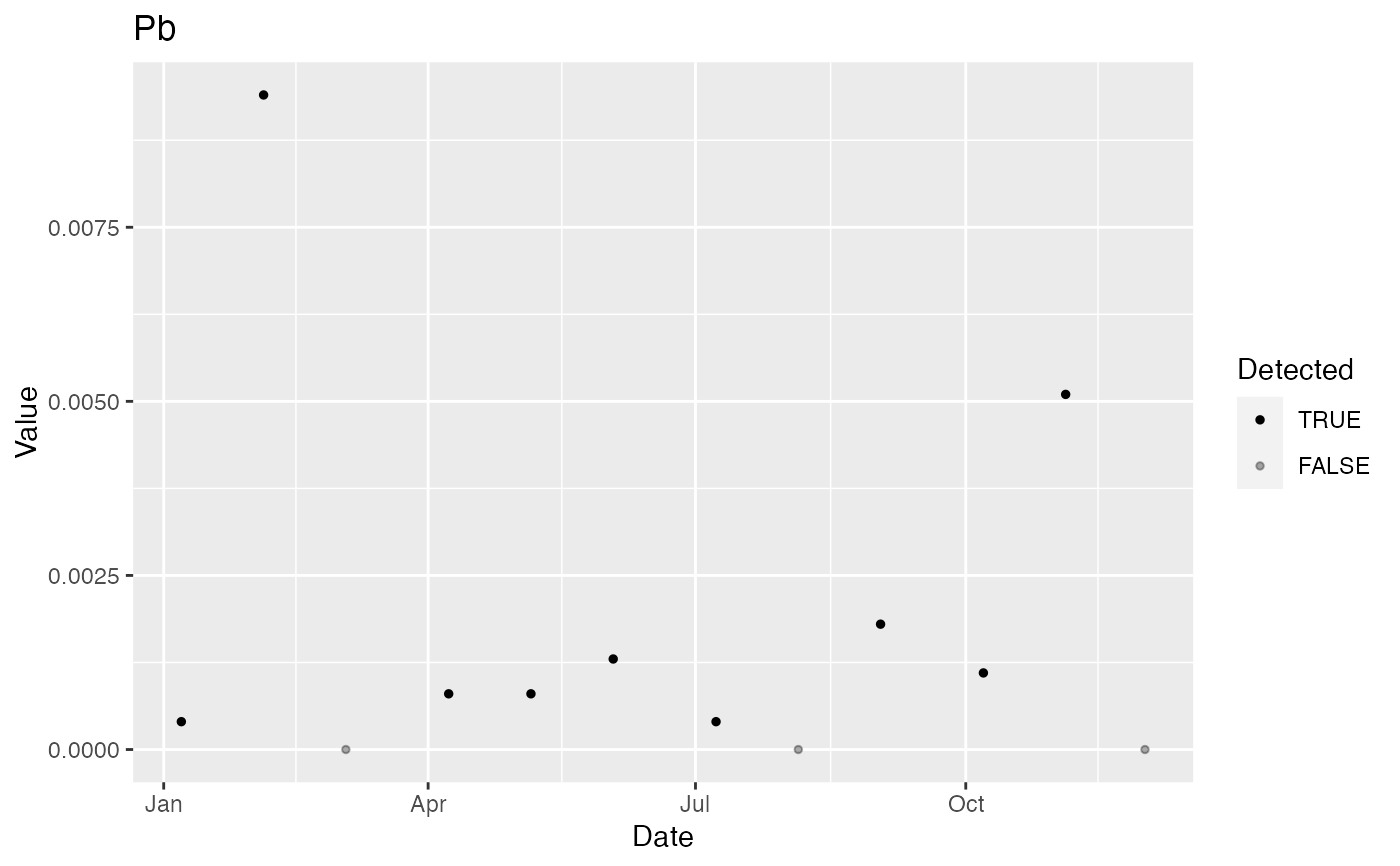
 plot_timeseries(ccme, by = "Variable")
#> $DO
plot_timeseries(ccme, by = "Variable")
#> $DO
 #>
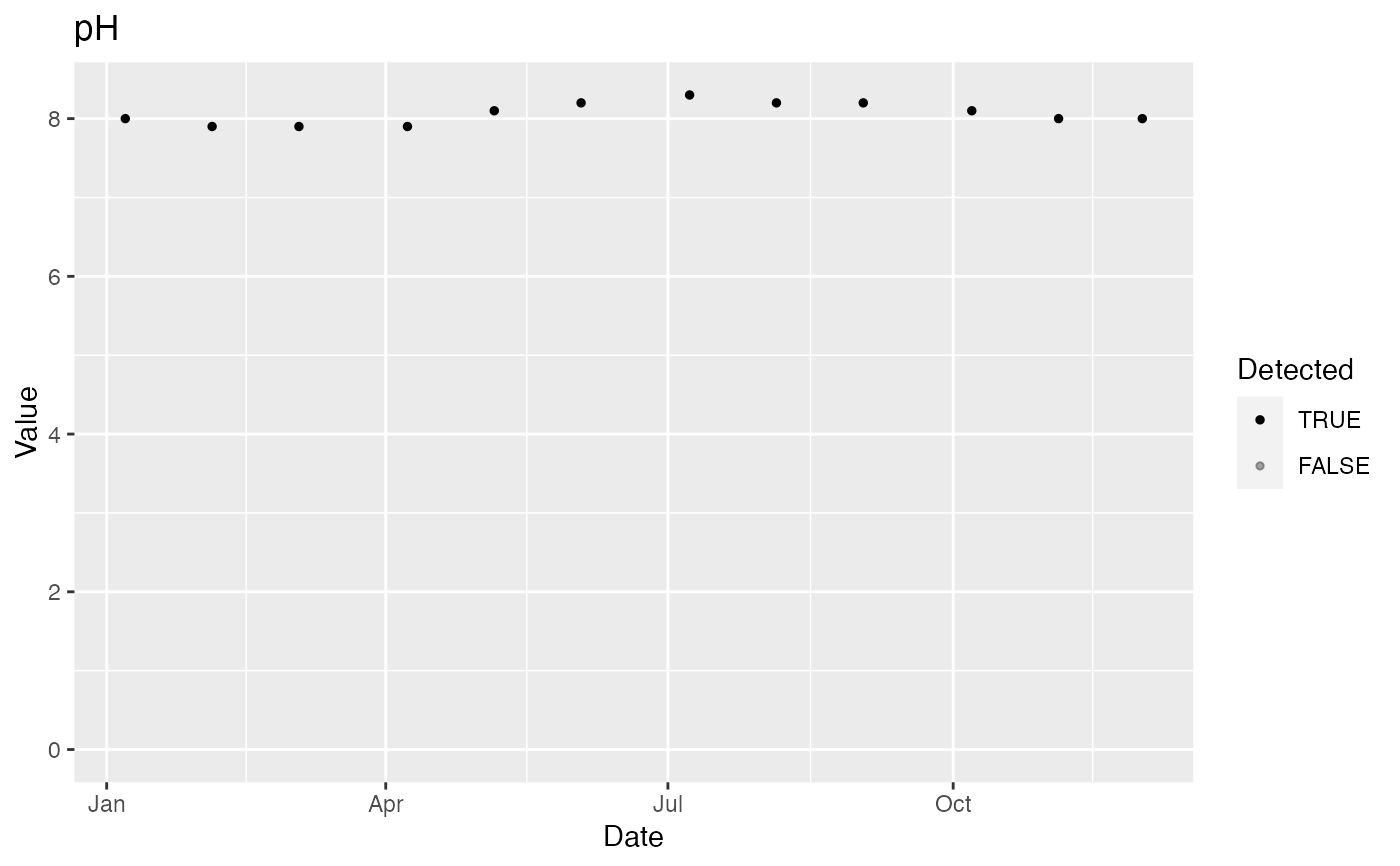
#> $pH
#>
#> $pH
 #>
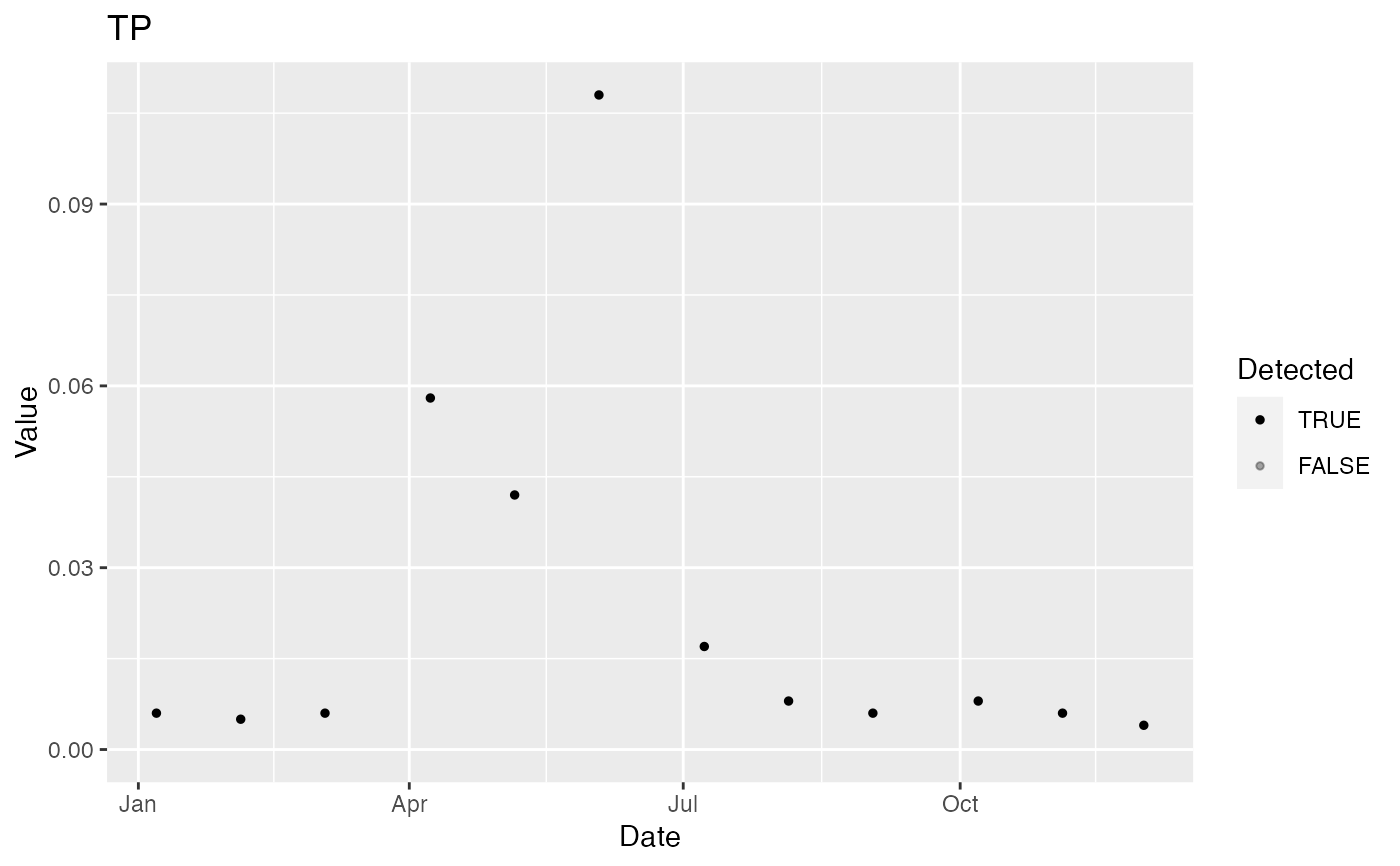
#> $TP
#>
#> $TP
 #>
#> $TN
#>
#> $TN
 #>
#> $FC
#>
#> $FC
 #>
#> $As
#>
#> $As
 #>
#> $Pb
#>
#> $Pb
 #>
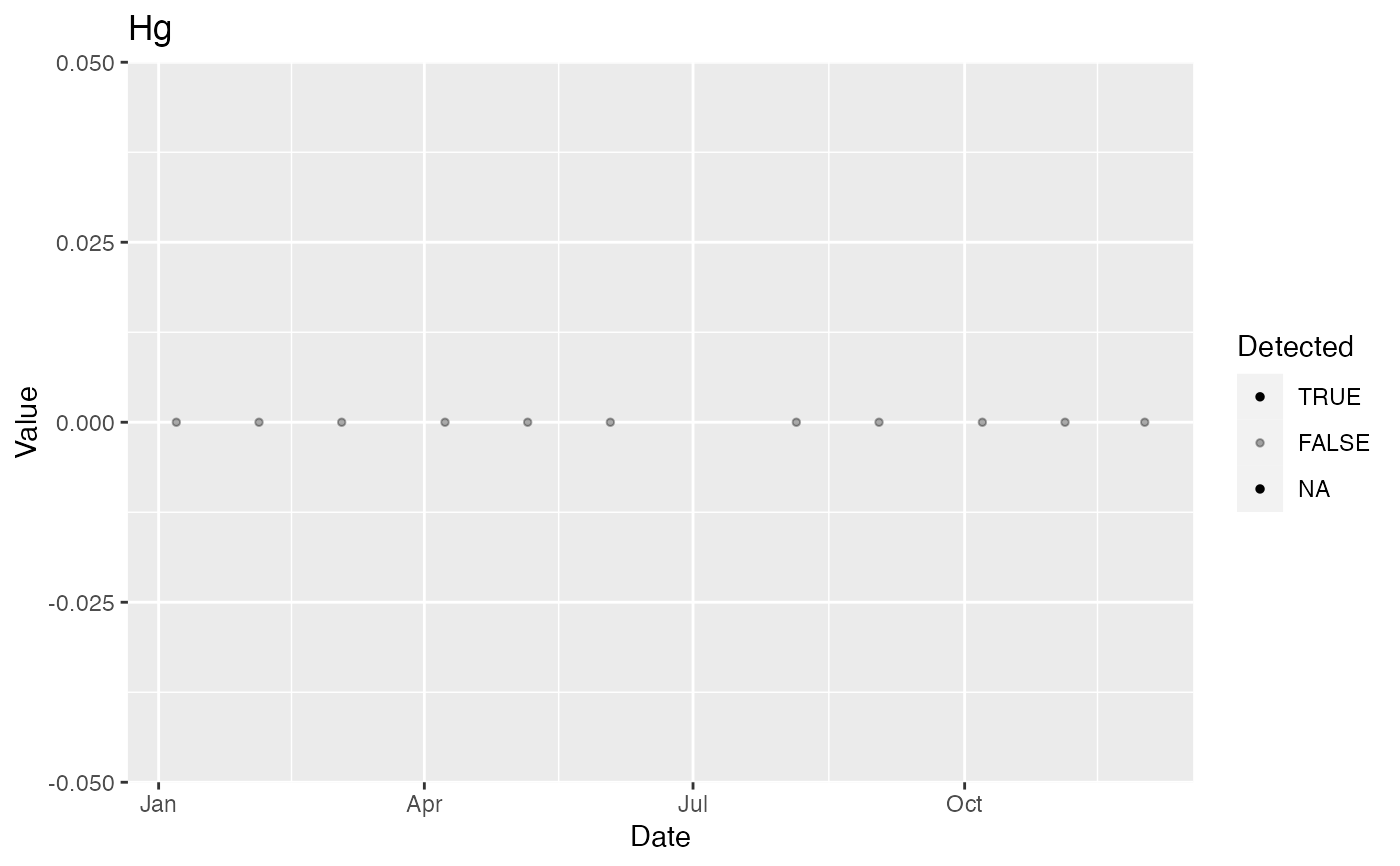
#> $Hg
#> Warning: Removed 1 rows containing missing values (geom_point).
#>
#> $Hg
#> Warning: Removed 1 rows containing missing values (geom_point).
 #>
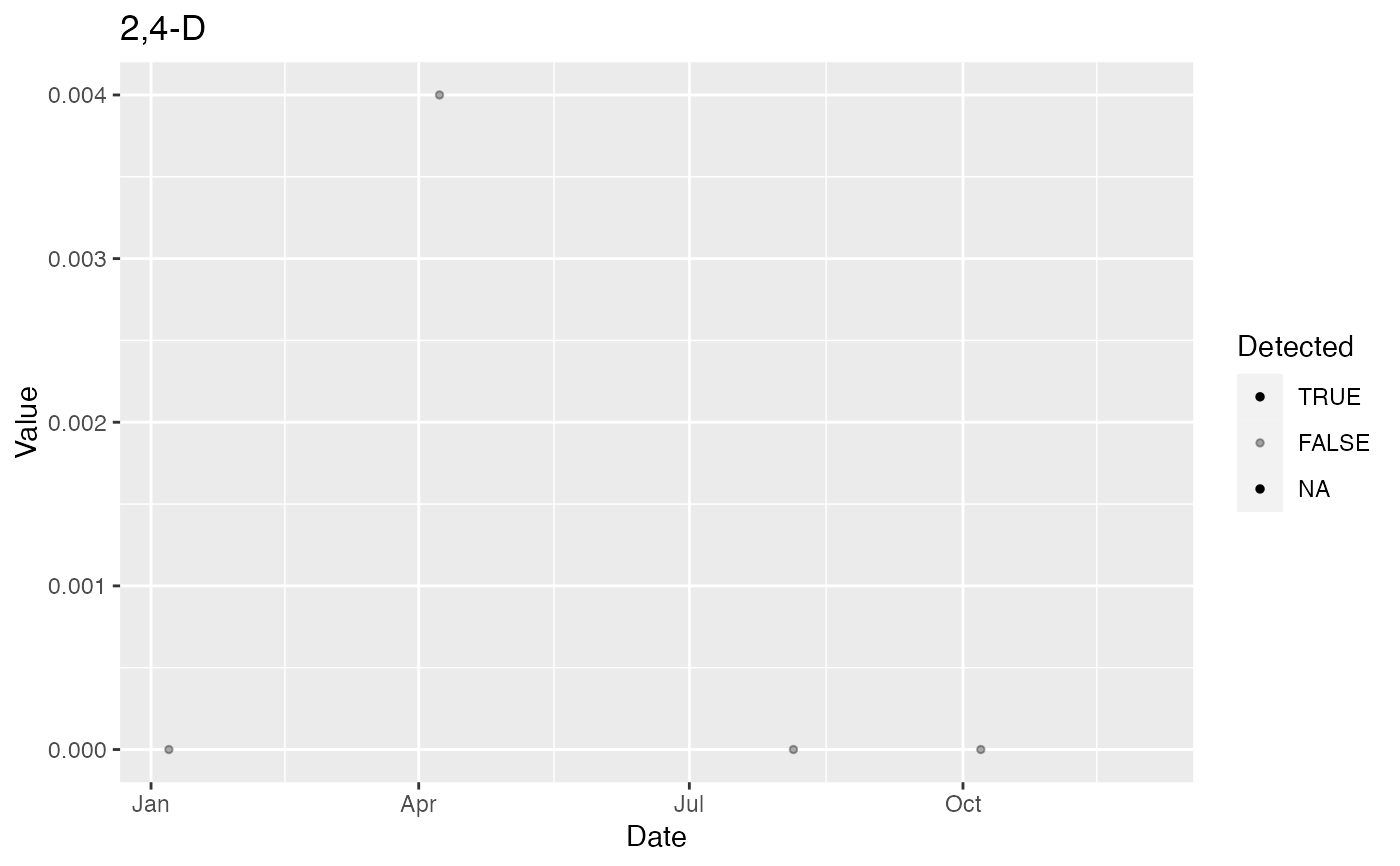
#> $`2,4-D`
#> Warning: Removed 8 rows containing missing values (geom_point).
#>
#> $`2,4-D`
#> Warning: Removed 8 rows containing missing values (geom_point).
 #>
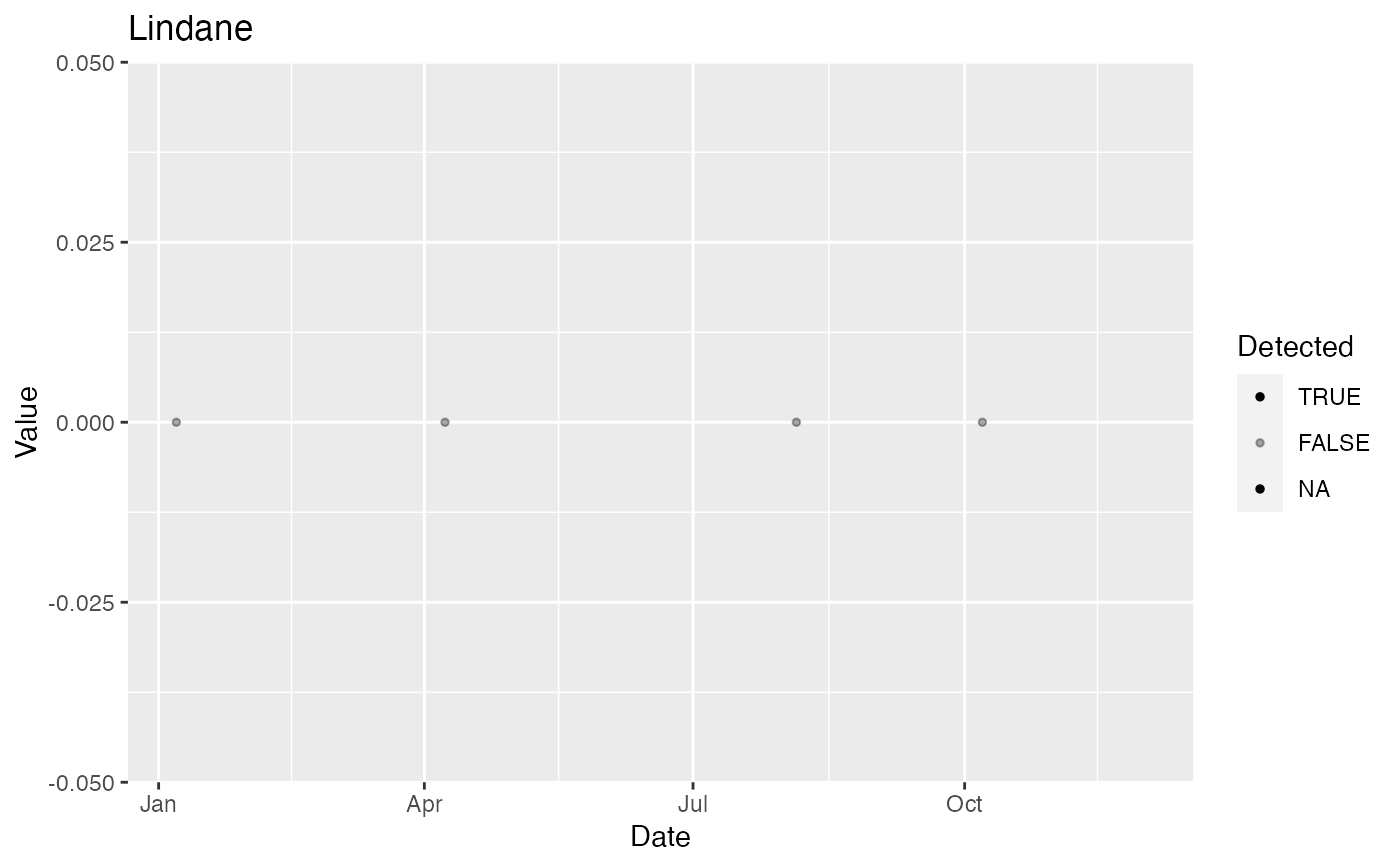
#> $Lindane
#> Warning: Removed 8 rows containing missing values (geom_point).
#>
#> $Lindane
#> Warning: Removed 8 rows containing missing values (geom_point).
 #>
#> attr(,"split_type")
#> [1] "data.frame"
#> attr(,"split_labels")
#> Variable
#> 1 DO
#> 2 pH
#> 3 TP
#> 4 TN
#> 5 FC
#> 6 As
#> 7 Pb
#> 8 Hg
#> 9 2,4-D
#> 10 Lindane
#>
#> attr(,"split_type")
#> [1] "data.frame"
#> attr(,"split_labels")
#> Variable
#> 1 DO
#> 2 pH
#> 3 TP
#> 4 TN
#> 5 FC
#> 6 As
#> 7 Pb
#> 8 Hg
#> 9 2,4-D
#> 10 Lindane